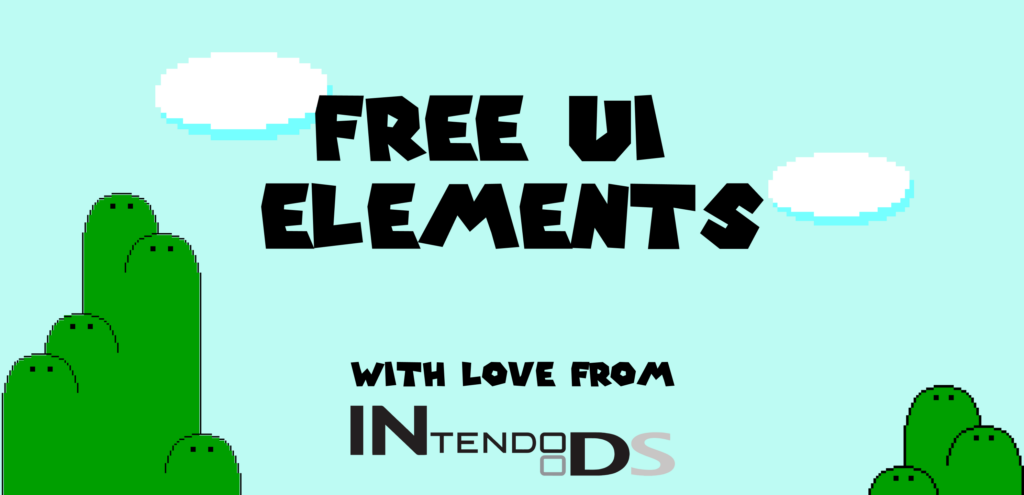
Sharing is caring, to the teams without a designer, here are some free UI elements to help you get started!
We recommend using Figma: https://www.figma.com/downloads/ (free design software), and to help you get started we collected some main components for iOS, Android and Web (fluent), and of course the Super Mario colors!
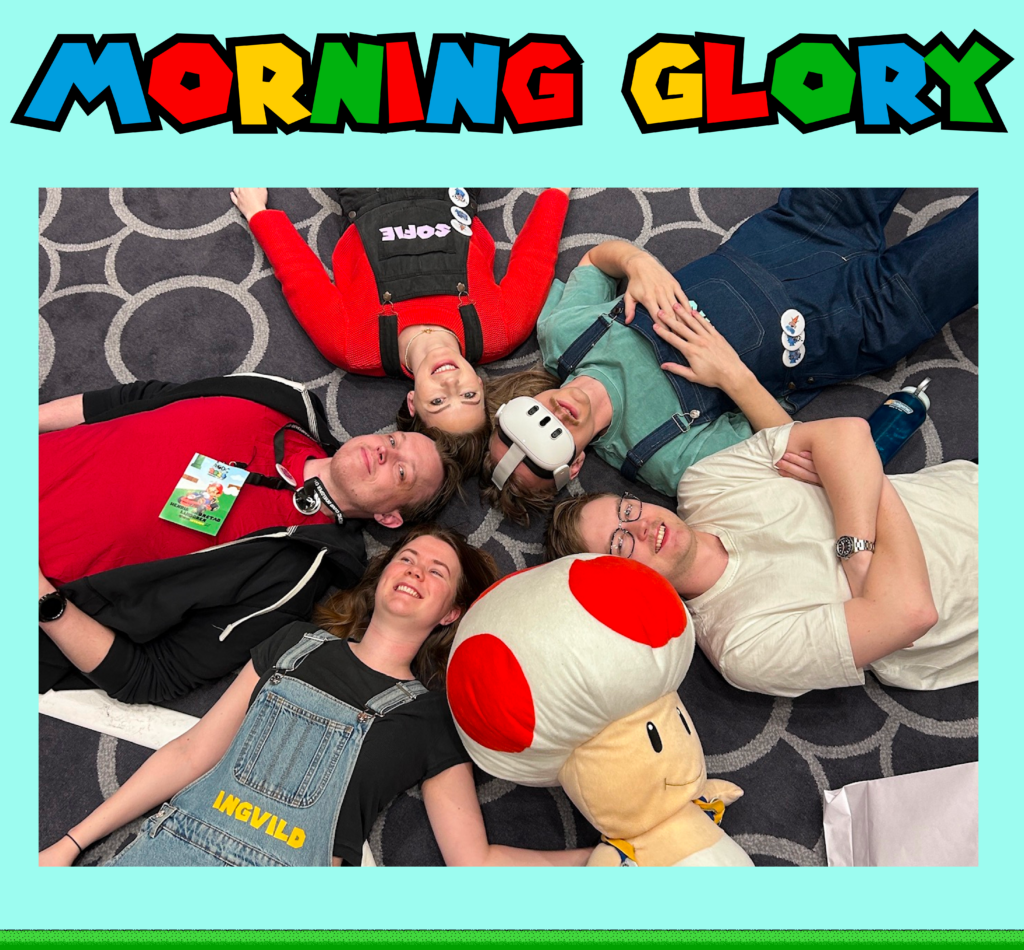
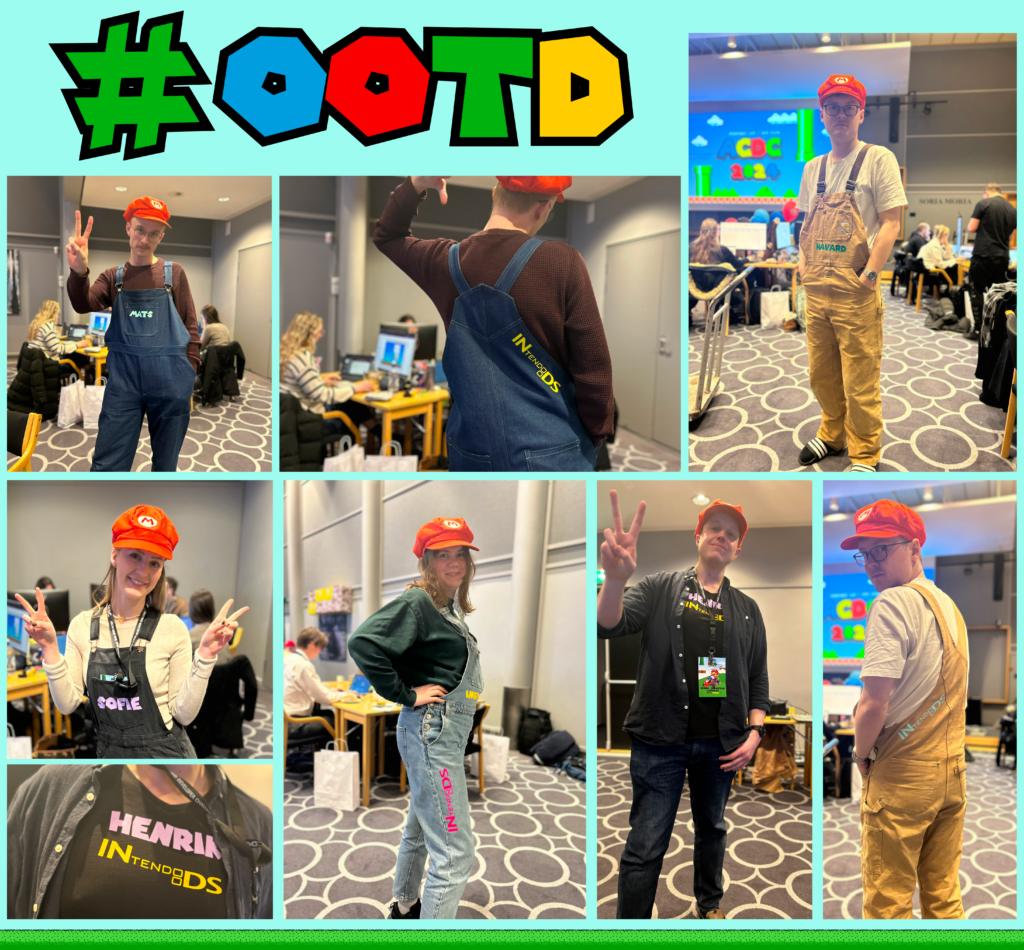
We want to show of our amazing outfits and Remarkable Teamspirit! Not only do we save time by wearing our dungarees everyday, we feel the Mario spirit and we look amazing. We bought them second hand and decorated them together.
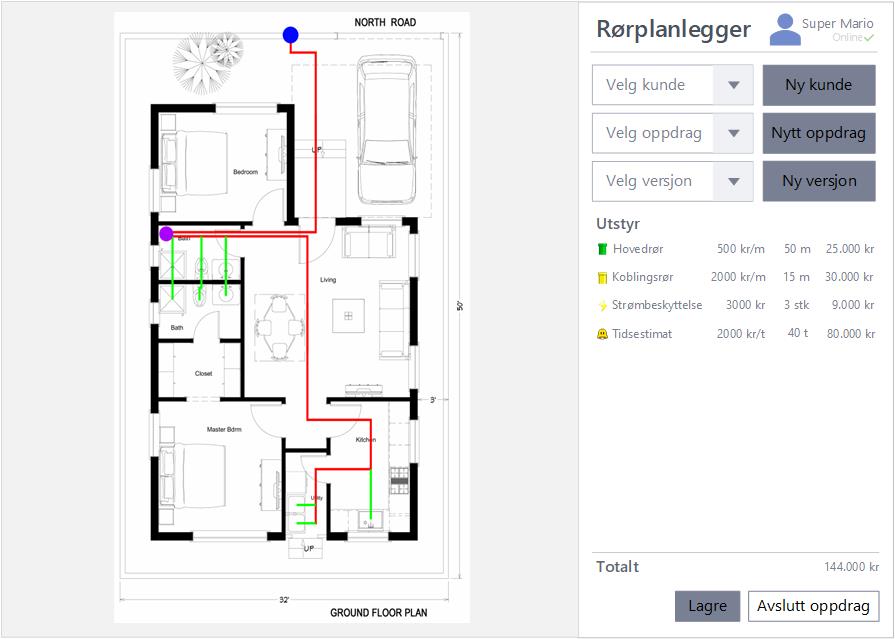
Super Mario isn’t always on adventures, and most of the time he is living a normal life while making a living as a plumber. A typical workday is full of tasks with different levels of complexity, and Mario would benefit from an application that can help reduce some of these tasks. Thereby allowing him to focus on the things he does best… Saving princesses and stomping turtles
Planning a plumbing system
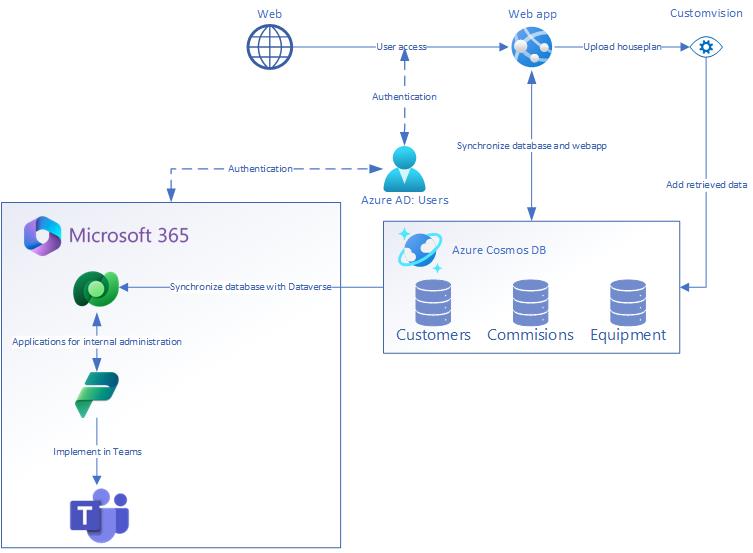
Our solution will be an application developed to help plumbers in planning and estimate the cost of a plumbing system. The basic idea is to upload a houseplan and use AI to recognize obstacles, items that need to be connected and other elements that will affect the final layout. The user will then be able to “draw” the pipes on the plan while avoiding obstacles and connecting required elements, while the application generates a list of components needed for the system and a cost estimate.
Using Azure and Microsoft 365 for communication and management
The user will log in using their Azure AD user profile to an web app that synchronizes with a database in Azure to make sure speed and accessibility isn’t a problem. From this web app they can upload a houseplan that is immediately analyzed using an AI service to retrieve required data. This data is the saved to the database and synchronized back into the app.
As a new commissions are saved to the database they will be synchronized to Dataverse as both a backup and for easily connectivity to the Power platform. By using this platform there will possible to develop solutions that can be used for other activities like accounting, communication, statistics, etc. This also allows an easy implementation in Teams, allowing users to handle these tasks on the go.
Picture yourself as a pirating entrepreneur: You are eager to get rich, be feared and get results faster than the old generation. We know you are vell versed in apps such as Uber, Fiverr, Porterbuddy and AirBnB. In short you want things on time, at the right location and as convenient as possible. This is why you need Plundrr.
“I never thought I could loot this much of coin in such a few moons. Yarr!”
– Pirate Captain Beta testing Plundrr
Art showing the Plundrr Skull and Sword logo with Plundrr name and tagline “get richer faster” underneat
Plunder is a Raid Planner
At the a first glanse Plundrr is a simple app, but it does a lot of the heavy lifting for you. You set your desired course – from one cove to another – and Plundrr uses machine learning, data scraping, powerful automation, advanced trigonometry and vector calculations to pinpoint prime targets and map intercept courses for you. All you need to do is to show up in time and keep the sails full. However, for every raid there are are key factors for business success:
Find the Best Opportunities to Plunder
Steering Clear of Threats
Intercept all opportunities in most cost efficient manner
Challenge 1: Find the Best Opportunities to Plunder
Based on your ships course and destination Plundrr can estimate which boats will be in your path. But it is not enough to know what boats are there, you also want to know which one has the better booty. this is where Barenswatch comes into play: We scrape all data about all vessels on your rout and calculate estimated value of the ship. We use the ship classification and size of vesle to estimate the value of the ships cargo.
All opportunities are ranked and given a carrot score 🥕. The more carrots the better. Optimally we want to strike all triple carrot targets in our path and also deviate if total yield will be better persuiting triple carrots over single carrots. In short, 🥕🥕🥕 is better than 🥕.
“Using carrots for value! Haha, thats stupid but also so correct”
– øystein from @in1
Challenge 2: Steering Clear of Threats
There will be compassion out there. No worries, Plundrr’s has your stern. From barenswatch we also get classification types for warships, police and even with some tinkering and estimation: Other Pirates.
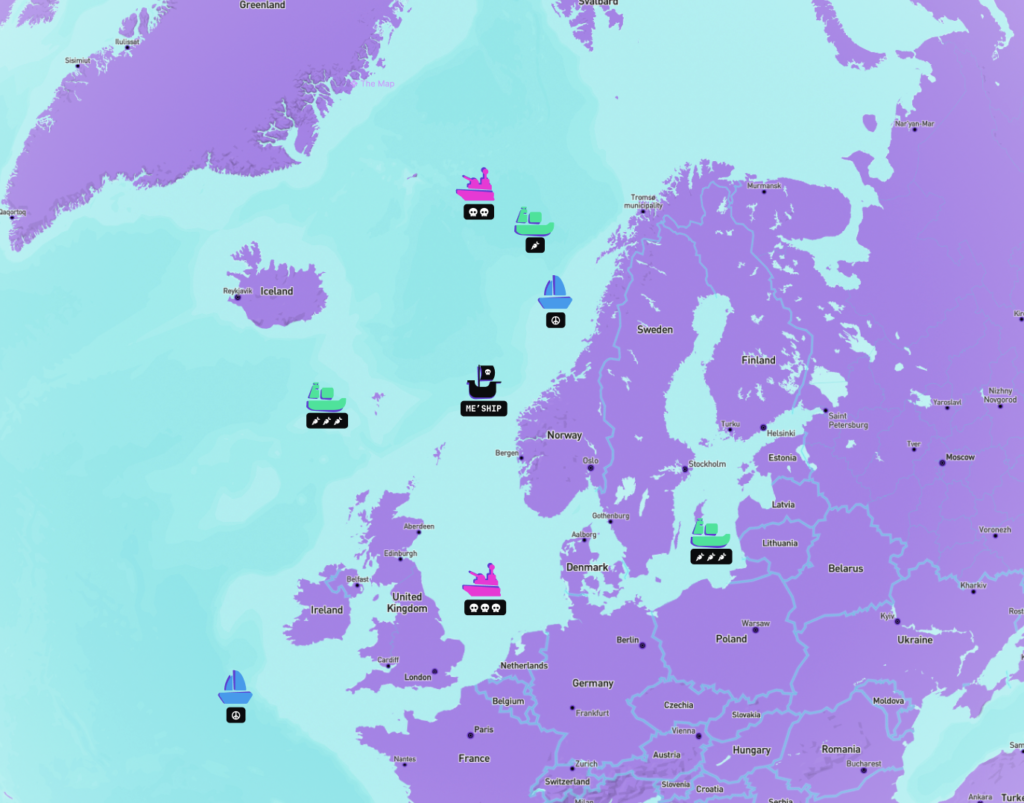
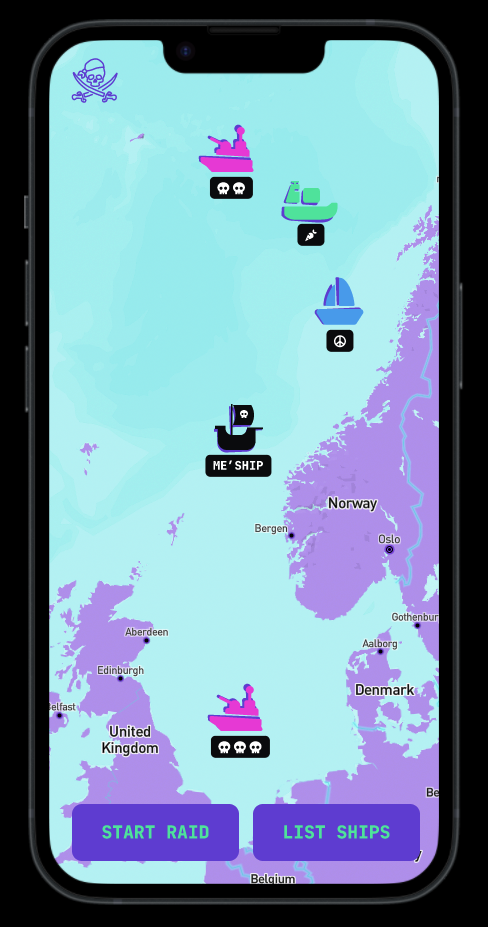
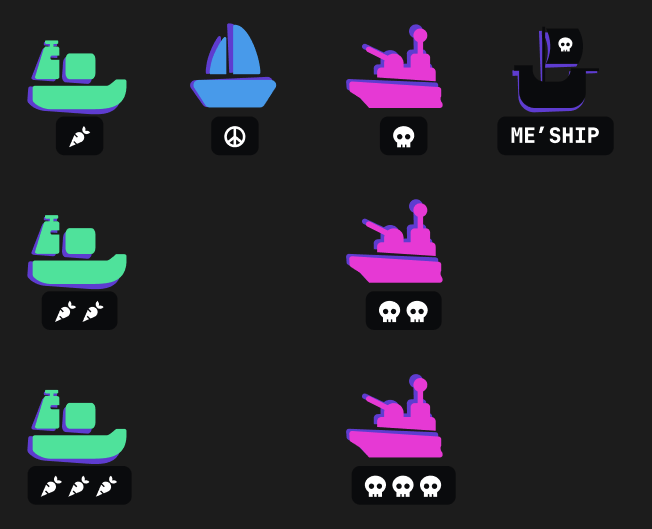
We label all ships as opportunities, friendly or threats and higlight which to avoid and what strength they have in the UI. We call this the Scull Score 💀. As for carrots, the more sculls the more danger. We allways reccomend avoiding tripple scull boats, however we give you the intel and freedom to choose to attach tripple carrot ships even when they are close to a single skull. This risk/reward judgement is for you to decide.
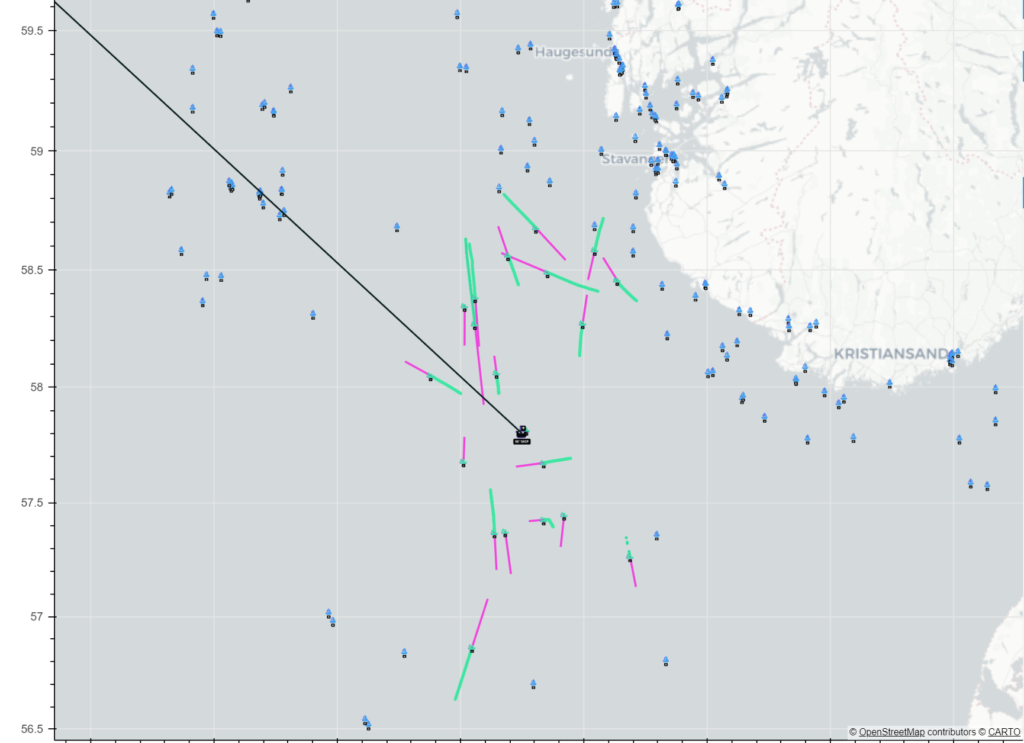
Screen grab showing the interactive map in Plundrr with icons for opportunities, threats and passive ships. Every ship is given a score from 1–3 carrots or 1–3 skulls denoting estimated value or threat level.
“Wow, I love how the UI is really clear. Also the boats are fun!”
– Håvard from @in1
Challenge 3: Intercept all Opportunities in most Cost Efficient Manner
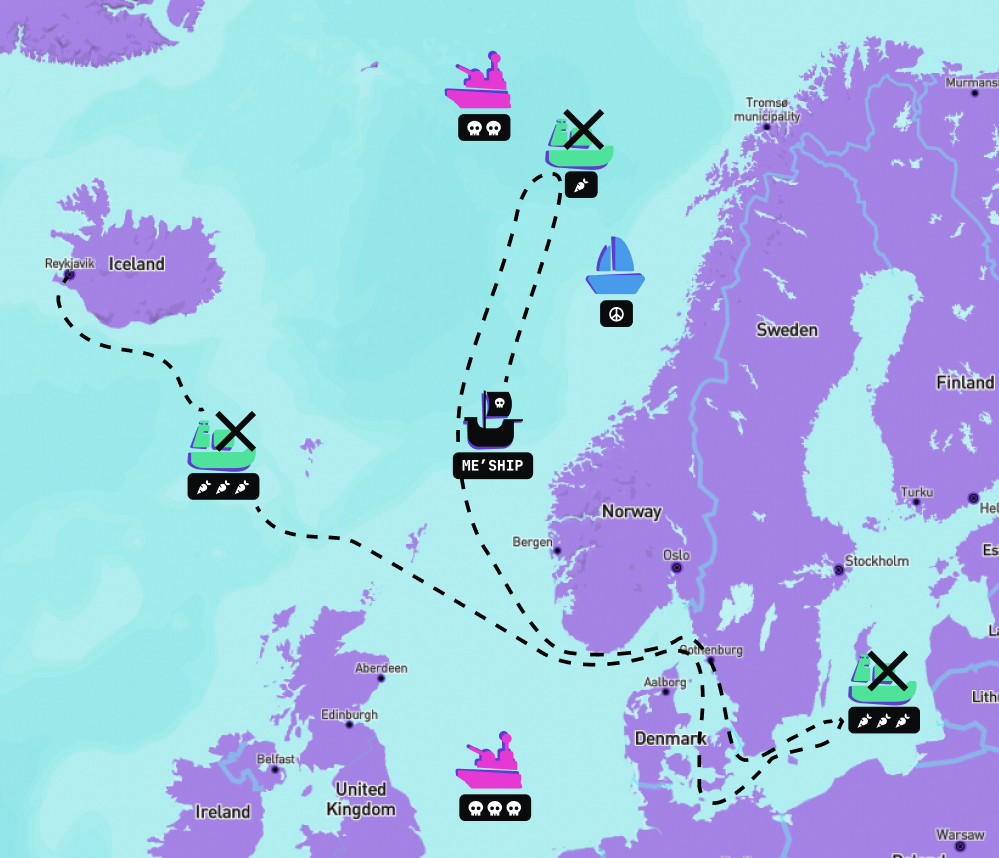
Once the user has chosen a rout, we plot that rout and use machine learning to simulate optimal target vectors. The problem we are solving is called the traveling salesman’s problem: A person travels from point A to point N ion a two dimensional plane. In between his origin and destination there are multiple opportunities for sales scattered in every direction. Our challenge is to plot the optimal course between ale opportunities traveling the shortest totalt distanse. Although for sea travel we need to slightly adopt the model to account for sea current and the travel of other ships.
Illustration of plotted path between opportunities avoiding high risk
Exploring the Technical Side
The technical Architecture, although straight forward leverages Power Automation and Power Flows to achieve more with less.
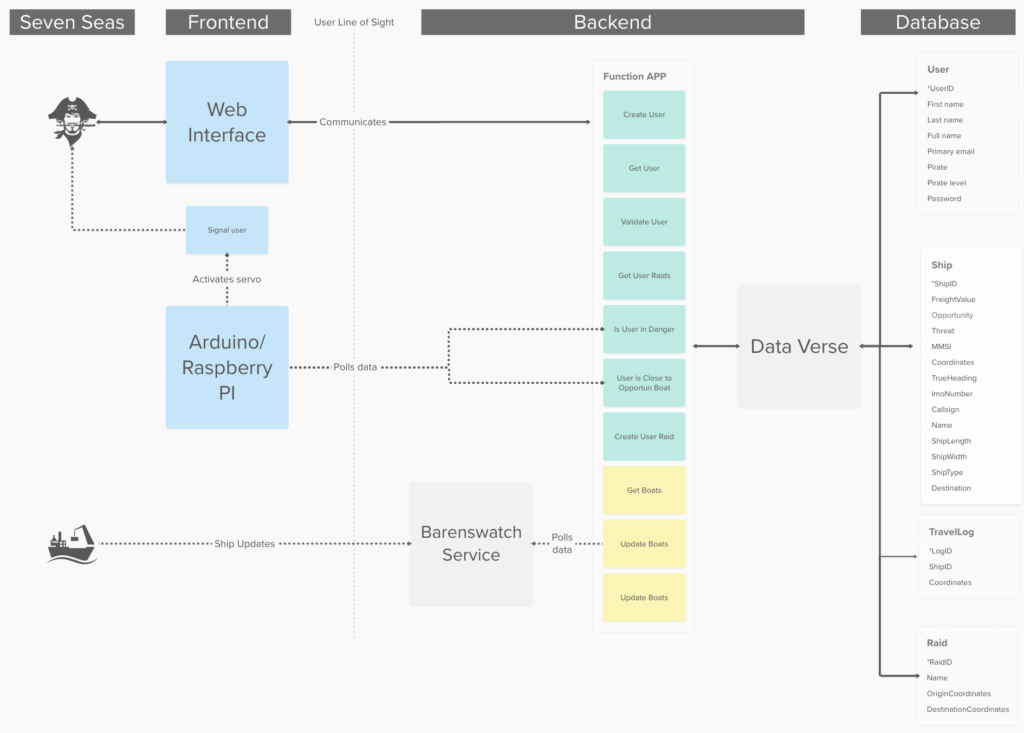
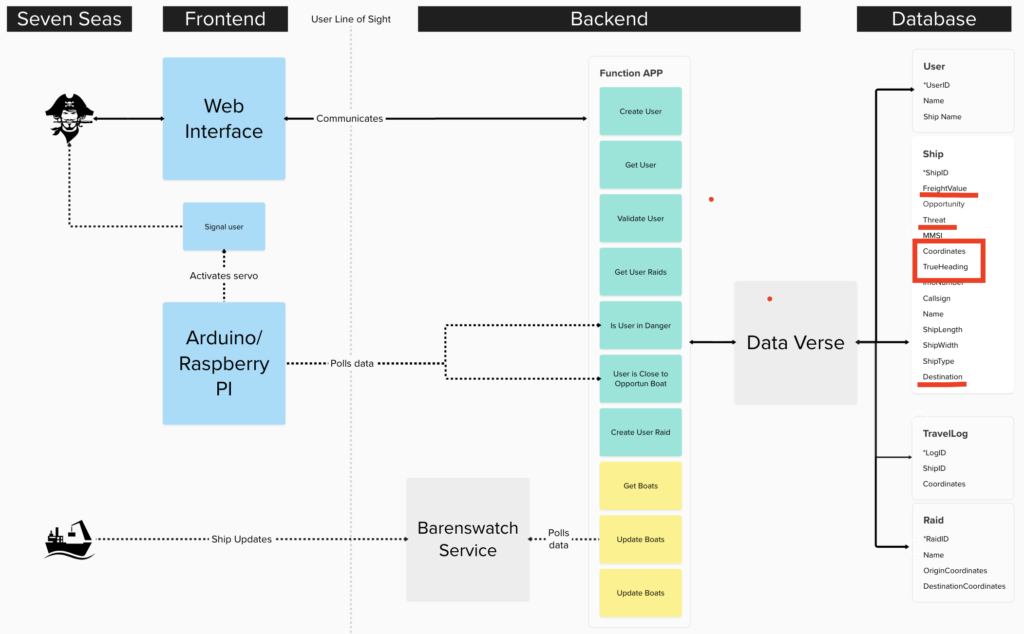
System diagram showing the technological architecture of the app, moving from what the user sees on the left, crossing the “users line of sight” into the backend structure showing the Function APPs services and how the are connected to Dataverse and its data storage
Mining Data
Data is predominant gathered from Bareenswatch, an open API for ship traffic on the Seven Seas. For each ship we get heading, size, global position and weight. We store the data in Dataverse for further use and manipulation.
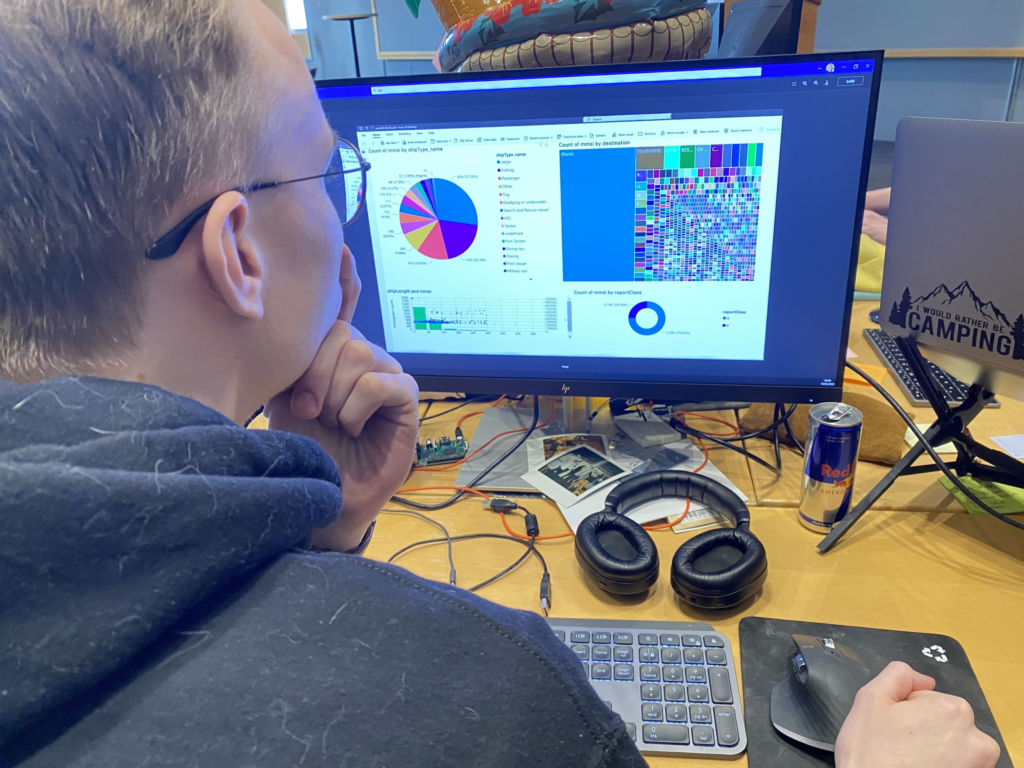
One of the ways we used the mined data during this hackathon was to viziualise ships as opportunities based on weight and size. The data was rendered in a Power App dashboard enabling the team to examine data to better understand how we should define high opportunity targets for Plundrr.
The data mining and visualization granted us badges in:
Dash it Out
Dataminer
Captain Mats looking at a dashboard showing data from barenswatch grouped and prioritized based on estimated value
Storing Data data Using Data Verse
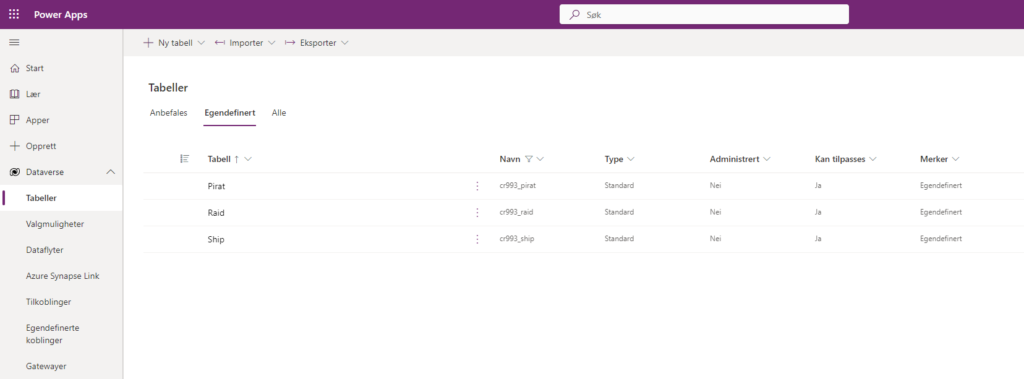
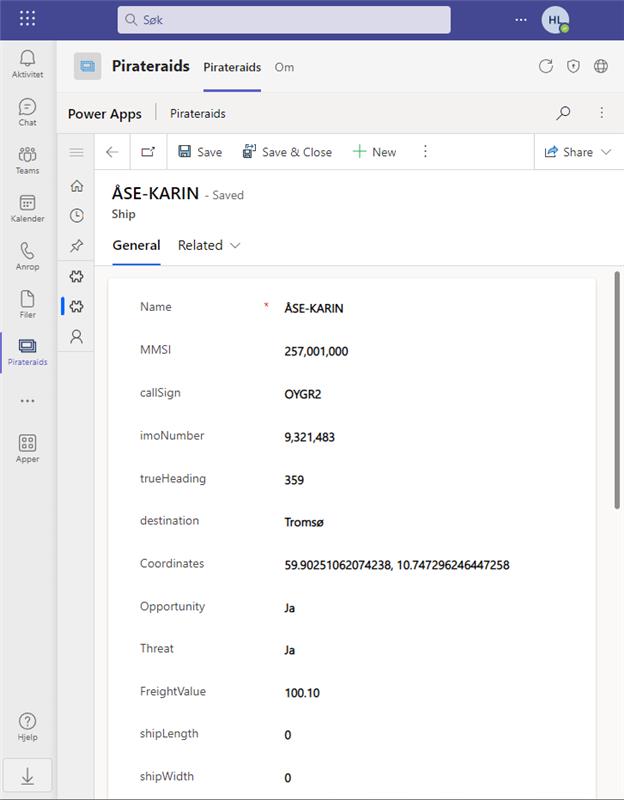
The backend functions of the solution is mainly built on the Power Platform allowing an excellent user experience when it comes to accessing and managing data. A modeldriven Power App is used as a killer app for administrators to work with saved information about raids, pirates and ships with travel logs. This data is saved in Dataverse to make sure a database is available for all kinds of applications created by users of rock solid geekness.
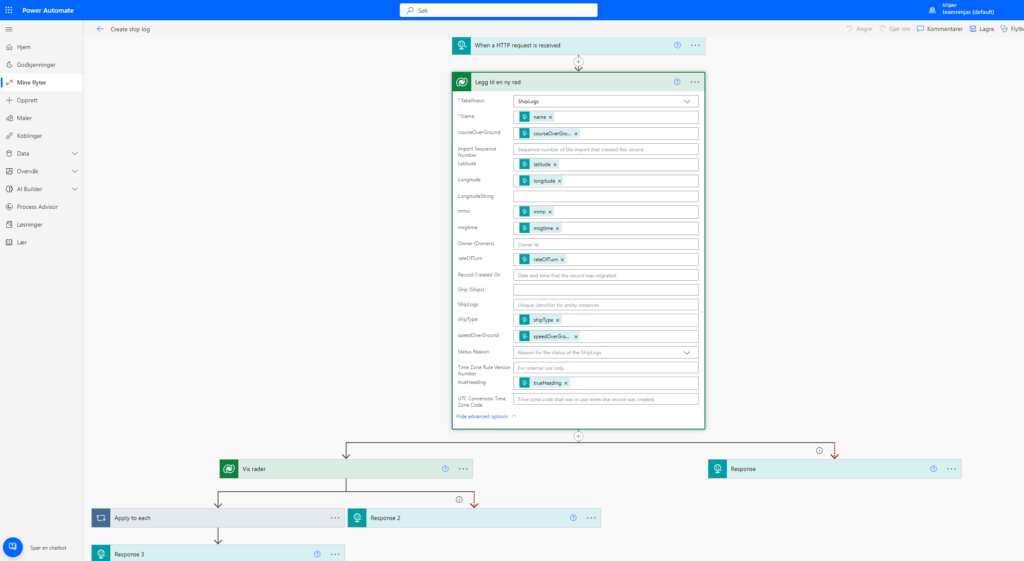
Flow fetching data from Barenswatch and storing to Dataverse
The tables in Dataverse can be accessed using Power Automate API, wich allow us to manipulate and control the dataflow, making sure each request is handled based on where it comes from and what it is used for. This way, a various amount of data can be returned based on input value, and therefore creating a most extreme business value where customers can retrieve amounts of data defined by how much coin they invest in the solution.
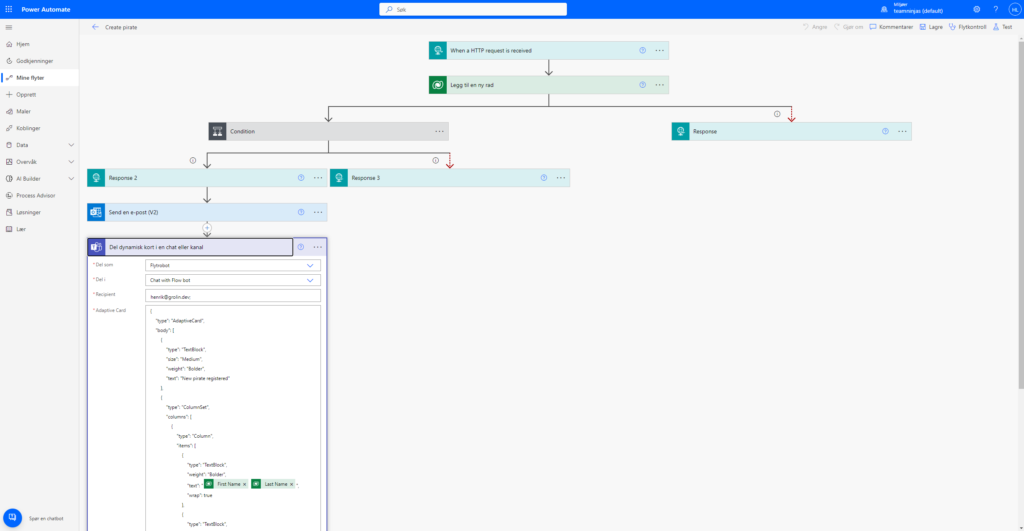
Flow that triggers events to Microsoft teams from new records in our pirate rooster
Use of Data Verse for the backend granted us badges in:
Go with the Flow
Power User Love
Plotting Paths using Python and Bokeh
We use the coveted algorithm “shameless extrapolation”, taking into account the ships current speed to estimate the ships future route. The 20 closest ships are considered opportunities and highlighted with the bright turquoise icon. Hovering over ships in the map gives information about name, type and destination.
Paths are plotted using Bokeh – a Python framework for creating graphs and plots.
Initial research into plotting and vector calculation made us explore prediction algorithms taking into account additional factors to predict opportunities location even furter in the future. Luckily after working on this we discovered we can achieve the same results with less complex algorithms like the “shameless extrapolation”, meaning we can decrease the cost of our service to the end user: Granting even more bang for theoretical buck.
“This is ridiculous. So much effort must have gone into this!”
– Rune from @in1
Solveig’s ☀️ amazing work awarded us badges in:
Crawler
The Existential Risk
Retro
Solveig ☀️ researching vactor calculation based on tru north and origin of vessles.
Automating Deployment and Infrastructure
We built a SPA application with .NET 7 and React. With these tools, we have build a sturdy vessel that’ll weather any storm.
.NET 7 provides us a robust backend framework while React keep front-end shipshaped. Together they make a formidable team that can take on any challenge on the high seas the is web development.
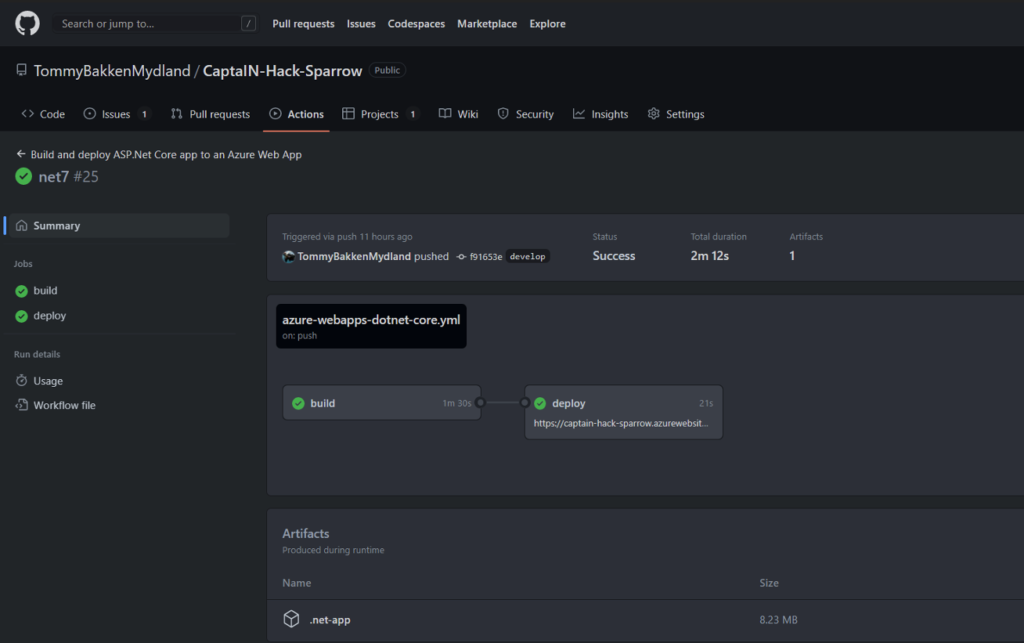
With GitHub Actions our ship will get the lates features and bug fixes in no time. Our ship is deployed with Pulumi, so we have Infrastructure as code and is running in Azure.
Screengrab from Github showing deployment and merging routines.
Use of these technologies awarded us the badges
Sharing is Caring
Power User Lover
ACDC Craftsman
Client Side Salsa
Packaging the User Experience
Good design is never an afterthought nor a last feature. Good design comes from understanding human needs and quality experiences. We wanted to appeal to an audience that grew up in the 90’s and are aquented to all the services the 20’s afford, like Uber, Tinder, Porterbuddy and Oda. Following an initial brainstorming we landed on Neon Retro as inspiration (cyberpunk music was playing at the time which might have sparked the idea).
“Wow! You can do this with Figma? I never knew. I’m installing Figma now.”
– Guy at luch I cant remember the name of
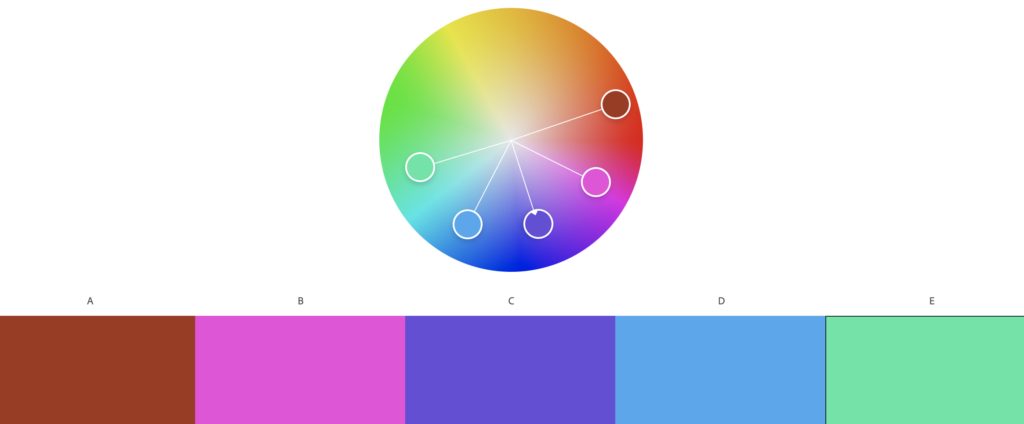
Fist step was to find a pallet and to create some sort of brand. We used Adobe Color to mix a color pallet based on a selected base. This base was used to make custom vector inspiring the rest of the apps design.
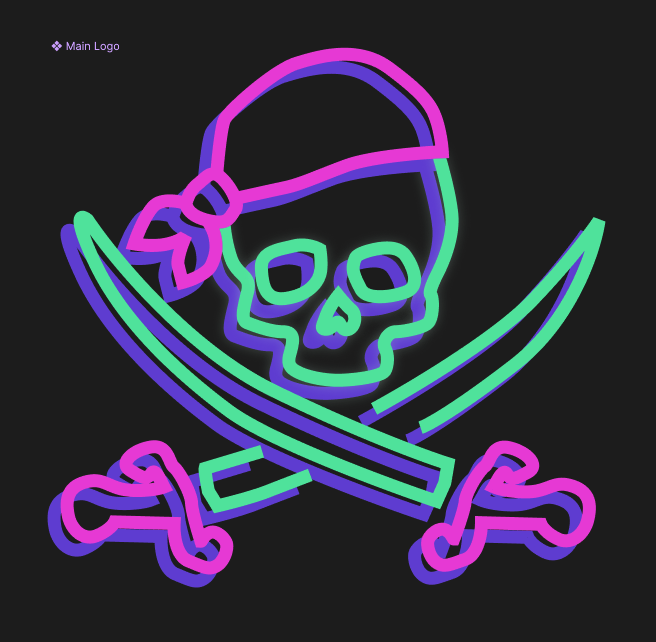
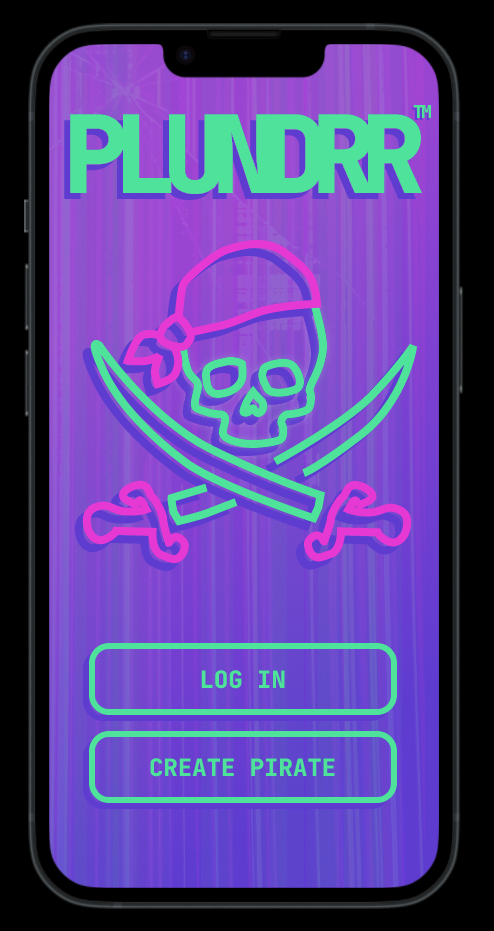
Screenshot from Figma prototype showing login screenScreenshot from Figma prototype showing map with highlighted opportunities, threats and friendliesScreenshot from Adobe Color showing how Analogous color ceperation was used to create a color palletCustom Vector Graphic for main logo inspired by Neon Futuristic designs.
The color pallet and main logos look and feel is used throughout the UI to make a modern yet eery subtly retro design. Icons for the app are altered versions for existing icons from Nounproject. Since they are heavily modified from originals we claim fair use.
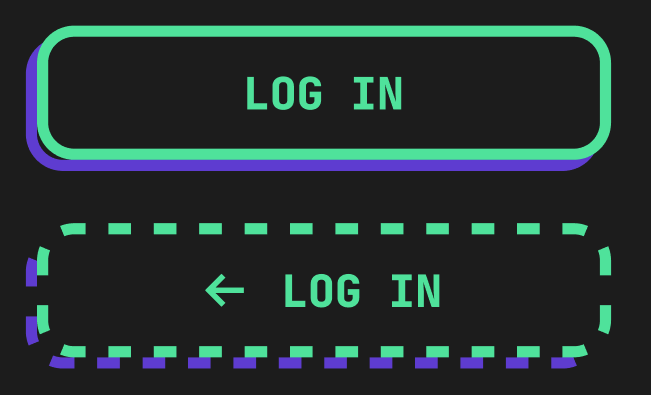
Example of buttons in the app, one style for main button and one for secondary action like “back”Set of icons for Opportunities, friendly, hostile and your own ship.
Prototyping using Figma awarded us these badges:
Retro
Glossy Pixels
Summarizing Three Amazing Days
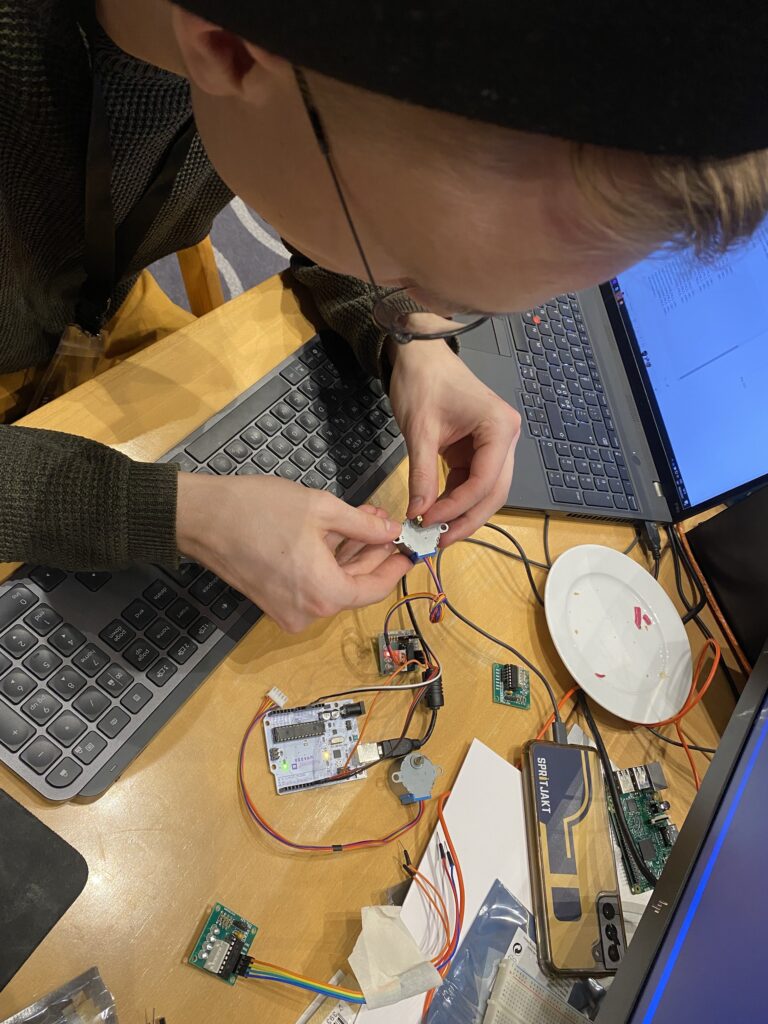
During the hackaton we’ve all been forced to take a step back and reconsider the direction of the project and our solutions. We tried connection an arduino to a Raspberry pi to use as a notification system for when the ship was in danger, but with (almost) faulty equipment and with limited knowledge, we had to scrap the idea. A lot of hours spent, and one could say wasted. But its not really wasted at all, as we definetly learned something on the way.
We are truly happy we got to test our limits, share our ideas with new friends and discover how awesome it is to be a happy camper and spread joy.
‘Tis true what they say, sharin’ be carin’ like a true pirate!
We hoisted our white flag and approached fellow pirates too se what needed doing. @in1 welcomed us aboard, even tucking away their plank for the occasion. They needed help fighting off backgrounds in their graphics, a honorable task to help with!
With the help of this fancy tool from Adobe (https://express.adobe.com/nb-NO/tools/remove-background), Tommy from @in2 successfully fought every and all white background in @in1 graphics. Resulting in clear and calm user experience, just like the friendly waters we prefer.
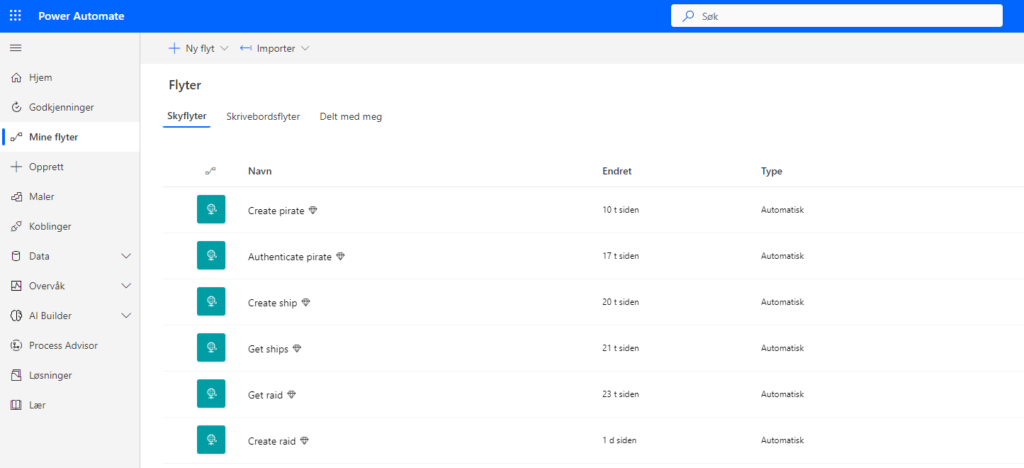
When plundering and sailing keeping track of pesky DM’s is no job for the captain or crew. This’ why we summoned the services of Power Automate and Power Apps to do our bidding: Enabling our ship to run smoothly and commands being forwarded at the correct time to the correct people.
It all starts with the Consumer of Data “Power Automate” who collects data from all our different intelligence points. Working in the shadows, this ghost can be attached to any workflow. Currently, since it thrives on human flesh for its operations, we started by attached to our crew log. Whenever Power Automate smells the fear of a new deck hand, laddie or lassie onboard it goes to work!
On a new pirate record Power Automate does two things:
Creates an Adaptive Card in teams and posted it to the ships group chat
Sends a welcome e-mail to the fresh pirate, explaining how they need to obey or walk the plank (all pretty standard pirate stuff).
Current Dataverse Tables the flow can write to and read from.Power automate flows that creates and updates records, when records for pirates are updated we trigger a Teams Integration.
Making the Captain’s work Screen Agnostic
We further improve the Captain’s life with Power Apps connected to the Power Flows. The Power App sits on the users phone, implemented via Teams or as a standalone app, and enables the Captain to administrate the crew roster, so any stowaway can be added to the crew and receive the required e-mail package with plank rules and NDA’s. This mobile approach lets the captain be in full control even when venturing away from his cabin and the desktop computer therein.
Screen snippet showing Power Automate triggering Teams Adaptive Card on new shipmate record.
The convenience of having the Power Apps in teams means the captain can manipulate his Ship, The Raids and roster from any surface, be it mobile, desktop og even tablet!
Screen snippet showing the Power App integrated into a Teams. Notice the responsive nature of teams adapting to any viewport.
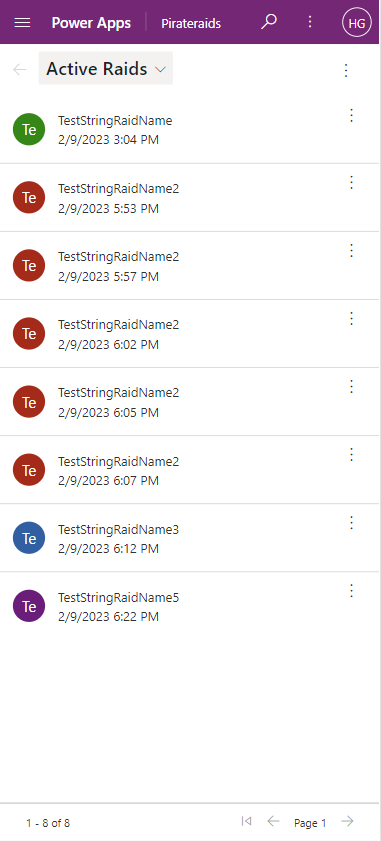
Using Power Apps means we can also simulate raids adding new test data on the fly, without it needing to come from our Power Automate flow.
User generated Raids in the raid table, created directly within Power App.
In Summary, for Sleepy Pirates:
The Power App enables our users to directly manipulate our data storage.
The Power Automate allow other sources and application to remotely access our data.
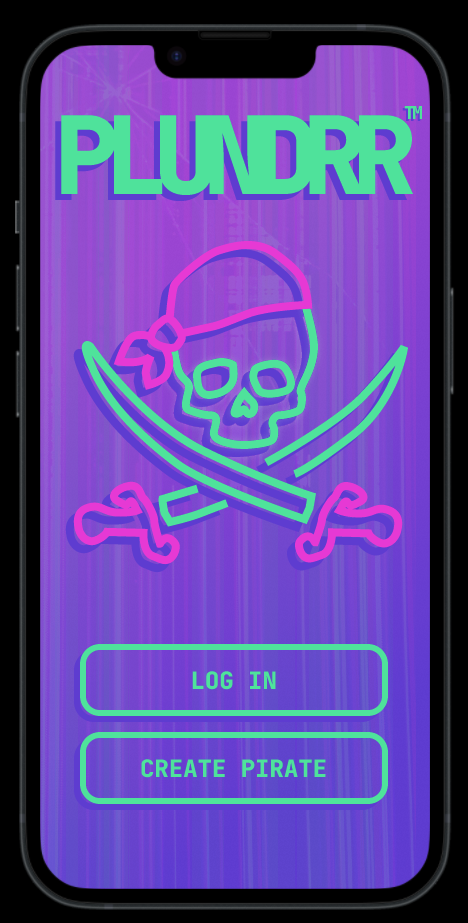
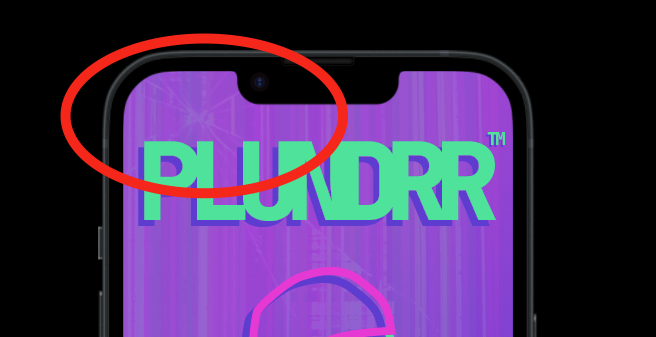
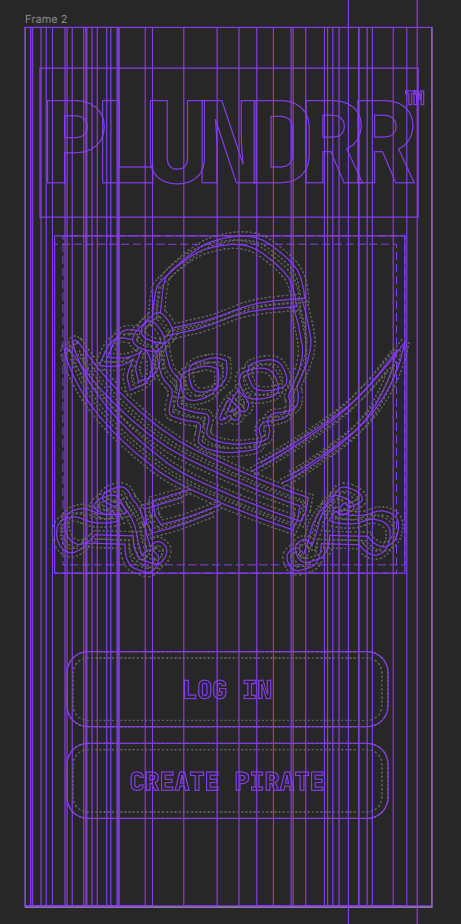
Perhaps you saw our resent post about colors and broken screens? If not the joke was the pixel pusher was given the broken screen. But as true entrepreneurs of the Seven Seas, we put our ripped flag feature front for all to behold. Introducing Plundrr, with pre cracked screen as part of the brand guide.
Detailed screen grab of the faux broken screen in our appFull screen grab of the mobile interface of Plundrr login screen. The logo is hand drawn and the faux cracked screen is created using mosaic patterns from multiple overlapping opace rectangles.
If you like cool looking and also super confusing things, this is the outline of how we create the cracked screen ripples using vectors. The scull and swords icon are also hand crafted using bezier curves: The mathematical way of describing how lines in vector graphic should bend.
Screen grab of how confusing it is to look at vector drawing with multiple overlapping paths as a wireframe
These engines turn at the whopping speed of 0.000001 m/s. Not only is the engine slow, the technology is old. The transistors that make the coquetry and the coils that make the engine revolve are the most retro data component of them all. Unfortunately we already claimed the retro badge, but would like to show you what we do with physical component and how we do small hacks to make things work.
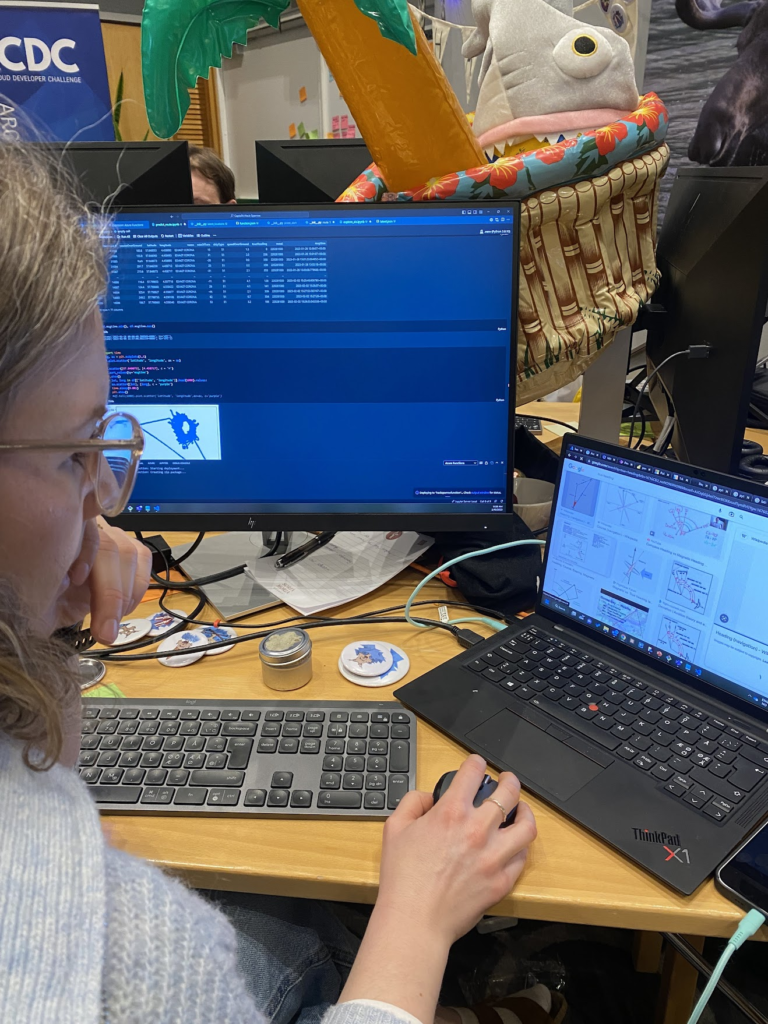
Captain Mats working on why the motor is not revolving at sufficient speed for what we require. Look at that focus! He is a legende! Girls and boys, he is unfortunately taken 💔
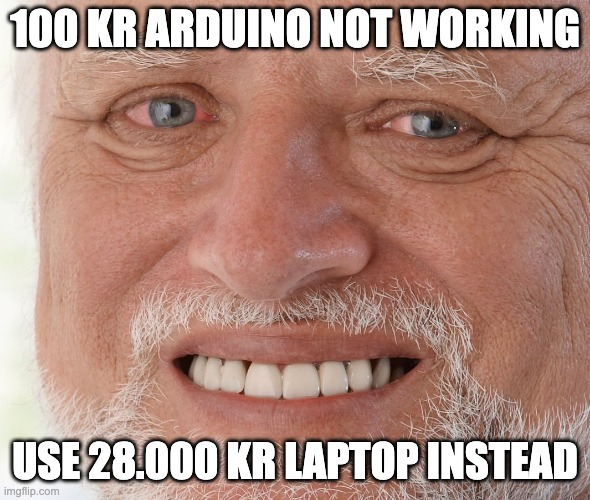
Unfortunately we had to hack our solution in the end, even with stellar help from Marius and @bastards we could not get the engine revolving any faster enough for our needs. The voltage output and ossilating is stuck making it perform suboptimal. We think the motor or voltage output needs to be adjusted but lack the tools and time, so the hack we ended doing was to swap the Arduino with the laptop and running a virtual Arduino instead of the real deal. Simulating something easy with something complex to make stuff work. We feel this is a hack in the spirit of making up lost time.
Meme about using expensive power computers to perform mundane tasks meant for matchbox computers
The waters run deep and dark when you are at sea. This is why intel like maps, a spyglass and knowing the tides help. To give our pirates an advantage we crawl barenswatch.no for other ships location. But, just as in dogeball, it is not enough to know where something is, you need to know where it is going and when you need to be there to intercept. So how do we calculate the best opportunities and how to intercept them?
Step 1: Crawl and Hijack Valuable Data 🦀
From the system diagram we see our Functions App communicates with the Braenswatch API and stors all boats data including current location. We poll this information several times giving us multiple data points not only for ballast and weight, but also for speed, location and direction (this will be important later).
Screen grab of system model for the Pirate Pillaging app
For ease of use while creating the service we compiled all the data using Power BI Dashboards to see what we were working with. The dashboard can also be used to help captains understand the state of the seven seas, although we appreciate that more data is not necessarily better data. It depends on how you visualize, precent and timing of when to precent data to you user.
Video of Solveig ☀️ explaining how we gather, structure, compile and visualize ship data in a way highlighting opportune targets.
Step 2: Knowing which Opportunities to Strike 🏆
From the ships length, type and destination we can estimate its value. Slow moving ships heading for freight docs are ripe for looting, fast moving ships heading for a dry dock are empty and better left alone. For the sharp eye you have also spotted we have a Threat flag in or model, this is for marking known pirates, intercepters and the fuzz of the seven seas. Once again referencing to Sun Tzu: You always win the wars you never fight (dont search this quote).
Image displaying famous quote from Sun Tzu about fighting good
If we decide that this opportunity is ripe for plundering, we look at its course and if it is feasible to intercept based on our current course. Good opportunities are heavy, slow moving ships. Bad opportunities are war ships of any kind or any opportunity in the vicinity of a war ship.
There is also a certain Goldilocks of opportunities: Based on your own vessel, you do not want to attack another ship that is too large, since it will be a harder fight, or too small, since it carries less booty. We can use the dashboard to visually find the opportune boats and use this investigation to write code that targets these boats automatically.
Captain Mats looking at data The Power BI Dashboard populated with crawled and manipulated data from Barenswatch.no, structured by ship type, weight and destination, highlighting the most opportune ships in the collection
When we flag ships that are both opportune and not adjacent to warships we plot paths to figure out where they are going in relations to our course.
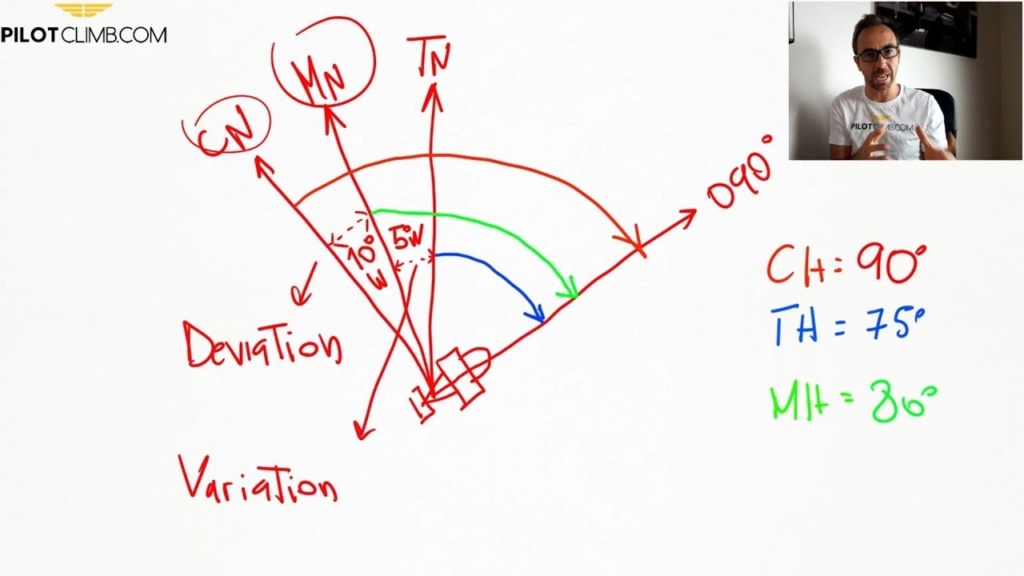
Step 3: Using Advanced Trigonometry to Pinpoint your Enemy 🎯
Youtube can teach you the basics about how to calculate a ships heading based on longitude, latitude, direction, true north and the course deviation.
Youtube is telling us what we need to know about complex
True north will change depending on where on the globe you are positioned, so for intercept courses it is paramount to get this stuff right. You want to be at the place where your target ship will be, not where they have been. And you want to be there before they get there, not to ride up after them and trailing them forever. This is where we use the latitude, longitude, direction and speed from earlier and _try_ to plot the path of the ships. I stress try because Solveig just looked at Sebastian with the “do you mind not being an idiot” when he asked how se was doing it and if it was done. Then just sort of sigh’ed and continued clicking keys. So it works, trust us.
Solveig ☀️ working on triangulating and plotting ships path to calculate intercept courses.
For our challenge we also need to estimate if it is a viable option to change our current corse to intercept the opportunity. For all business cases there is a cost/effect probability calculation. Fo us this depends on added time to destination with deviation and added length of trip, both of which adds to the total cost of provisions and consumables like petrol.
Step 4: Plot Optimal Course for Interception 🏴☠️
Finally when we have a list of opportune targets, we know which targets will be adjacent to our planned course form A to B we plot intercept maneuvers. Which, is a topic for another blog post – because this part is most certainly done… Trust us… 🤞🤞🤞