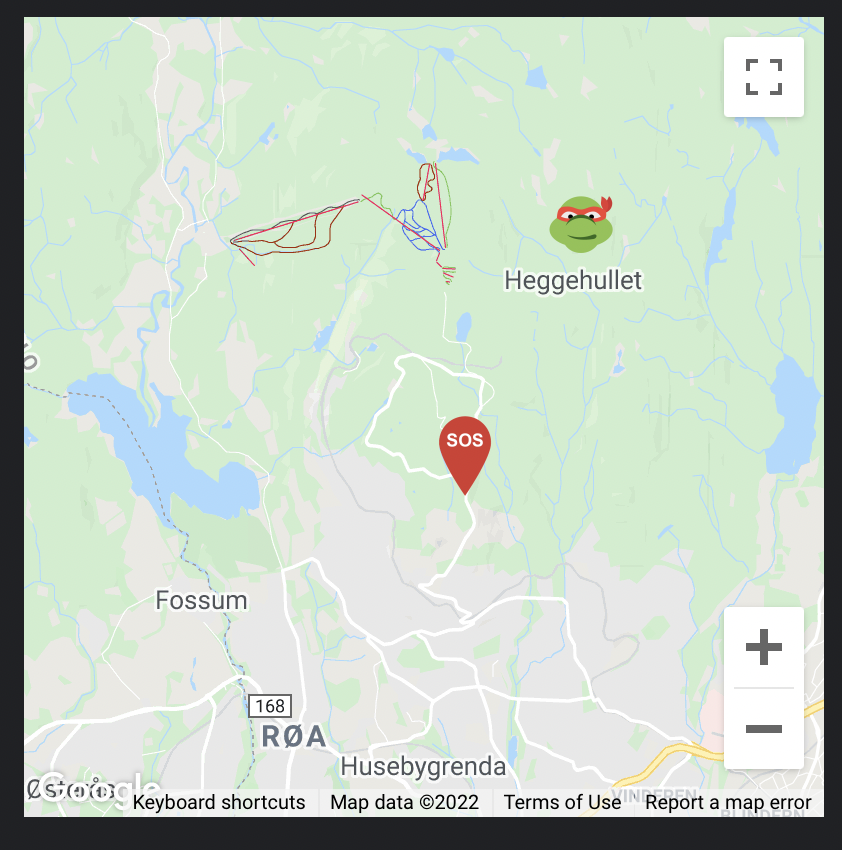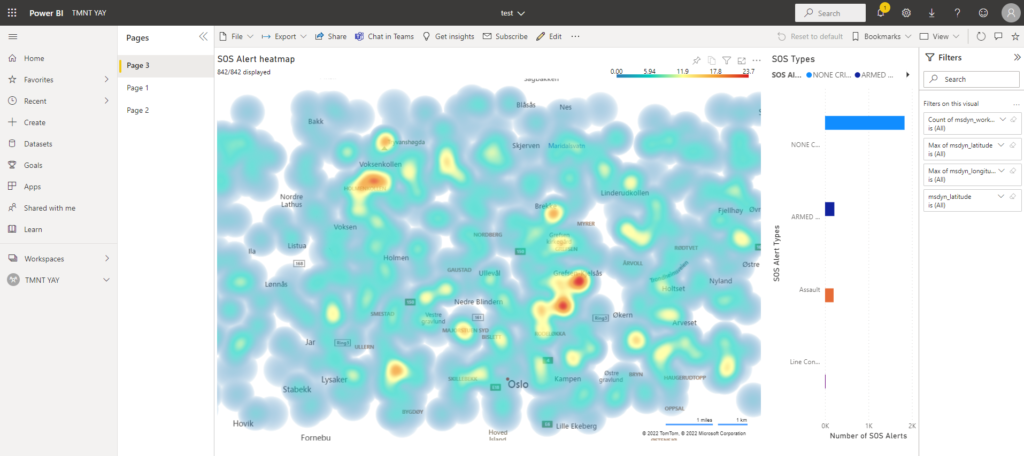
We have implemented a new Teams Tab app that monitors in real time where the turtles (smartphone in our case) are located.
One of our member are currently at the airport to travel back home to Stavanger. The video show that the Teams Tab App accurately shows her location at the airport and our location at the hotel.
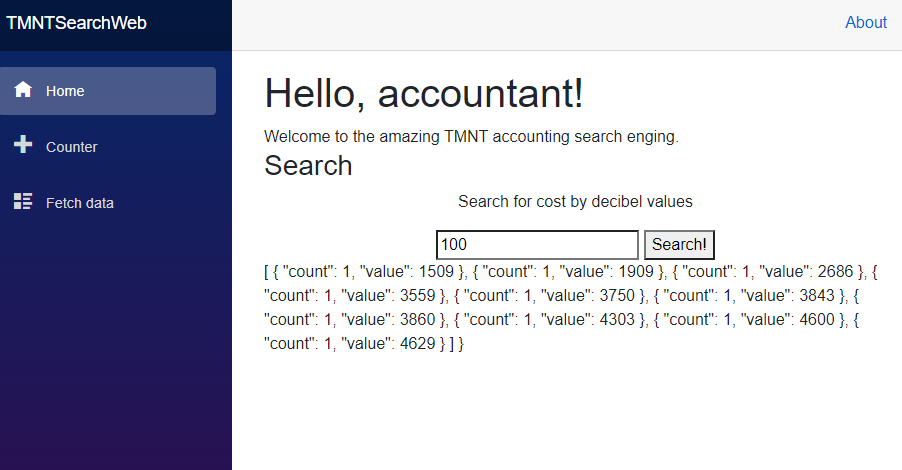
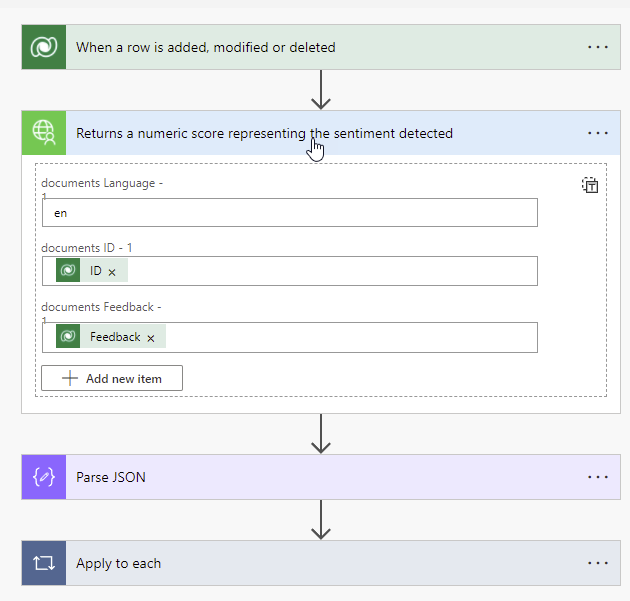
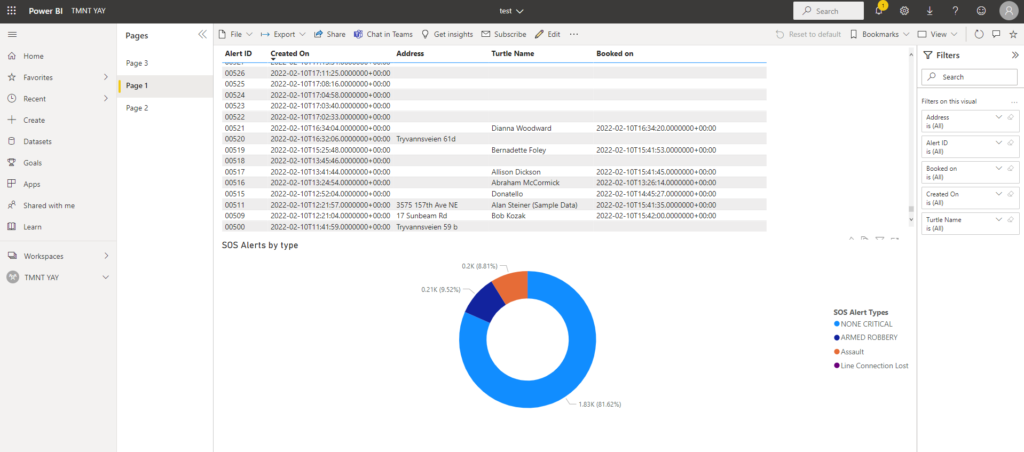
The video also shows geolocation data stored in Azure Cosmos DB. We are using React, TypeScript and Hooks to implement the Teams Tab App (Client Side Salsa) .
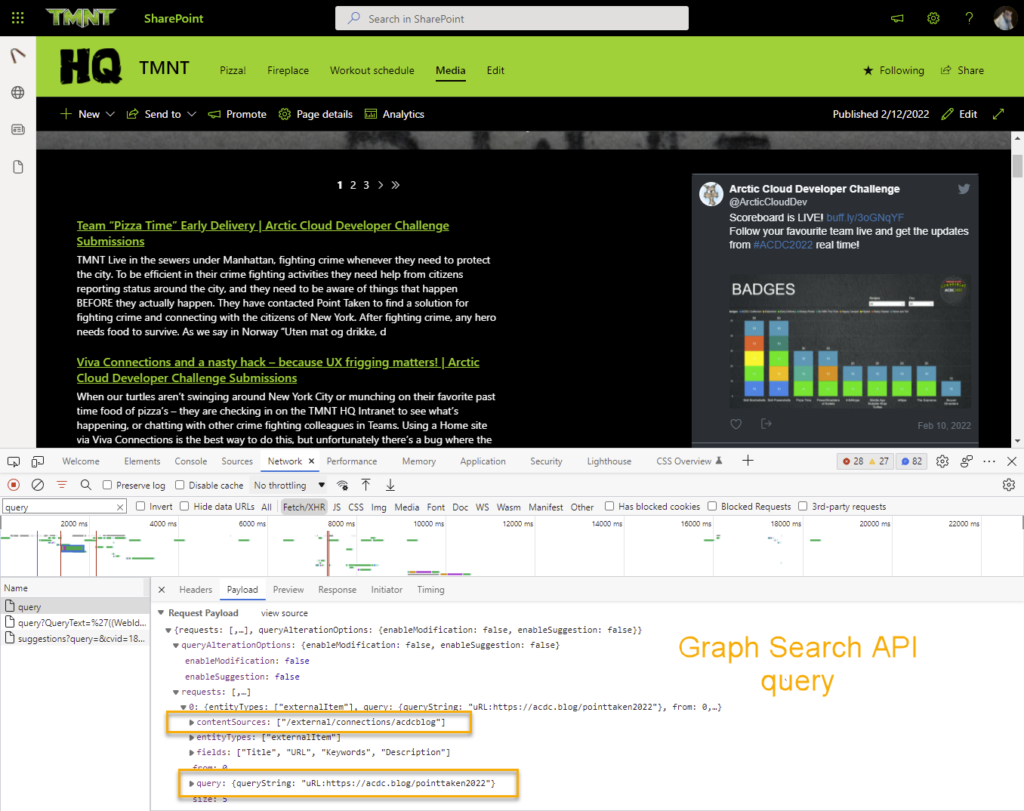
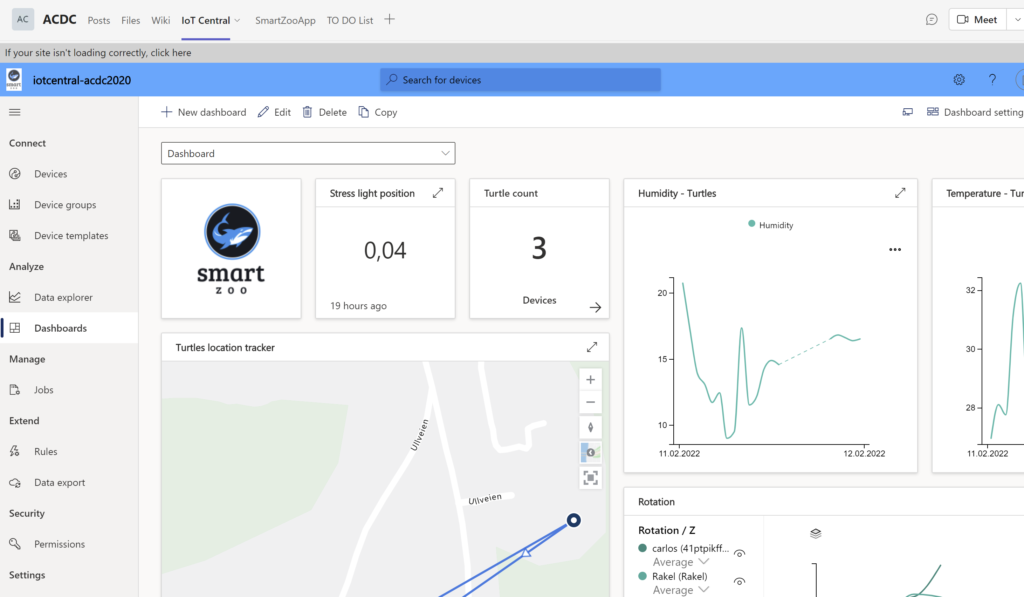
In our teams group we have also create apps to easily look at the IoT Central, Webflow website and TODO list. All the communication happens inside the Microsoft teams.
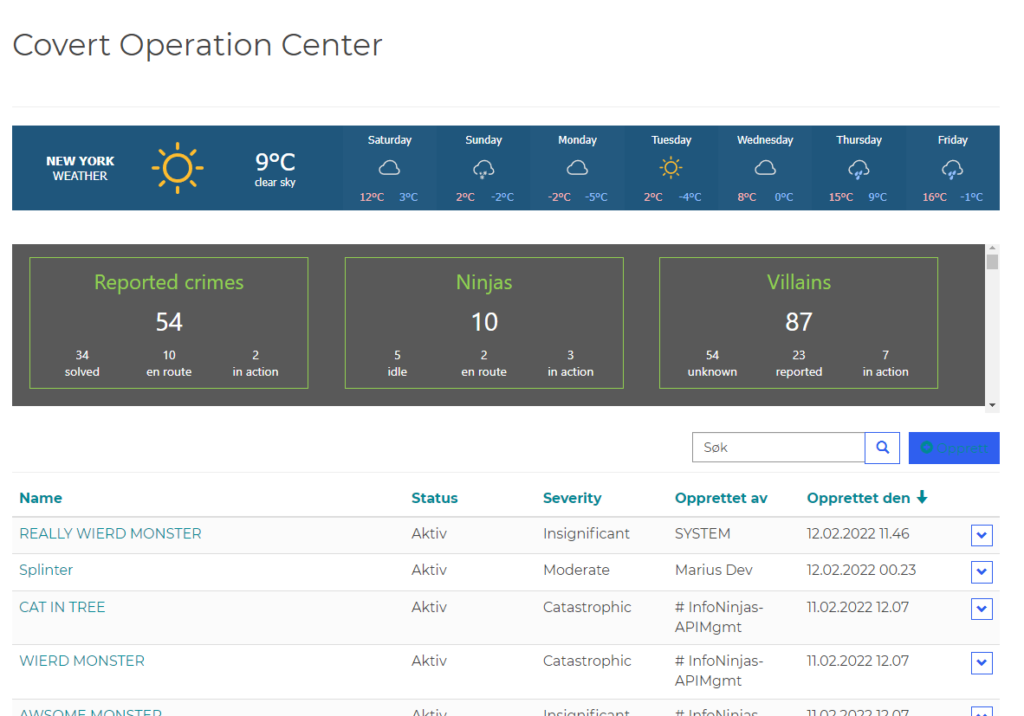
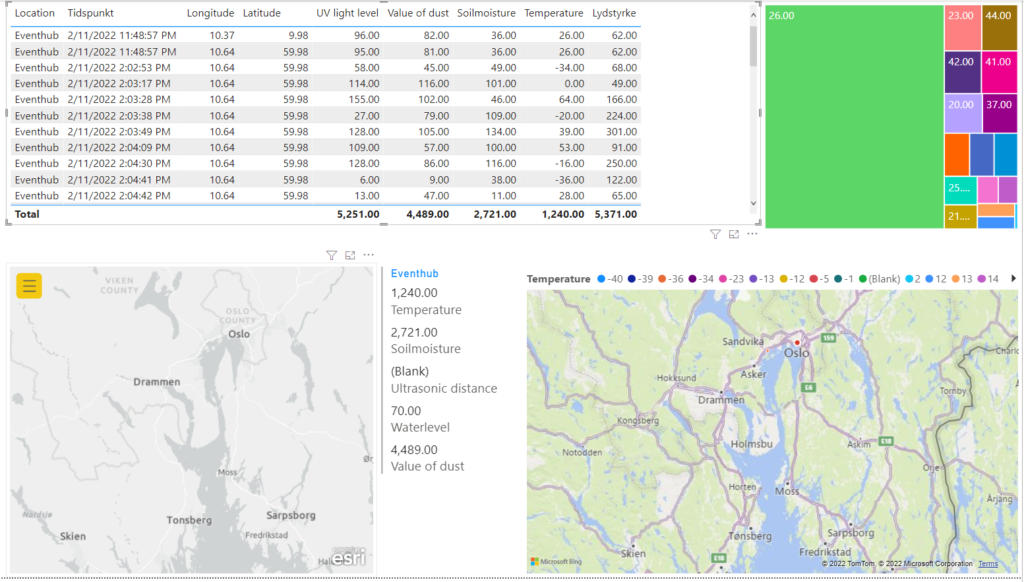
IoT Central:
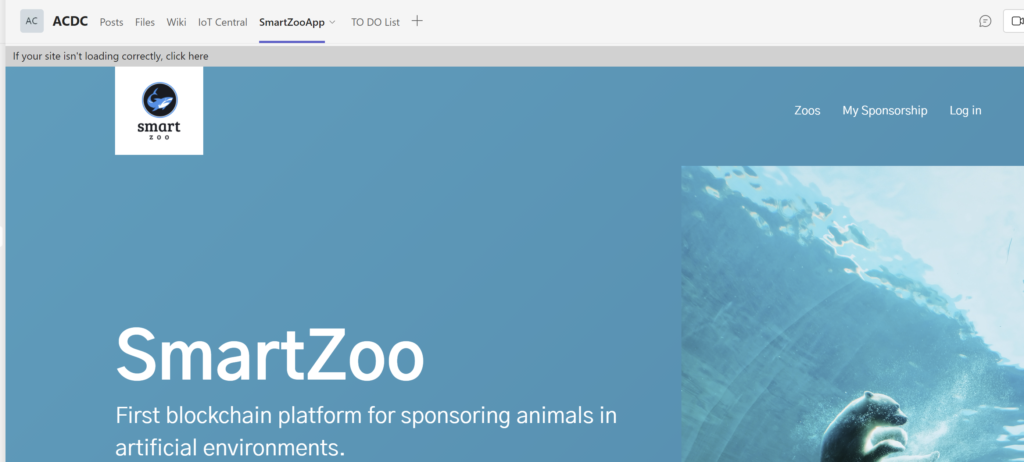
Webflow website:
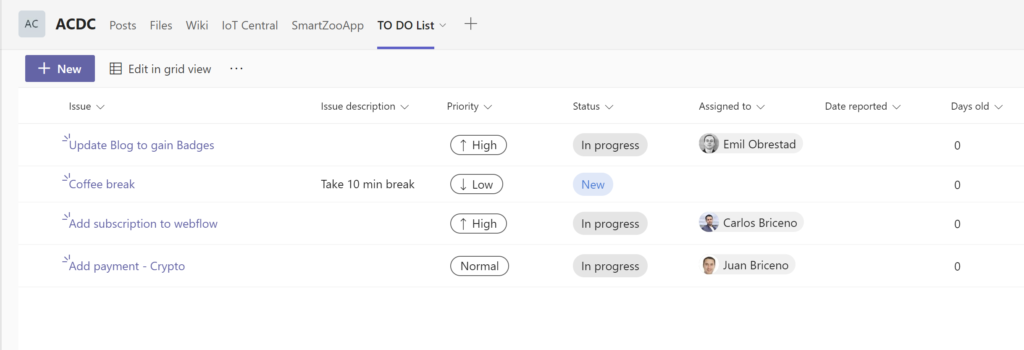
TODO list: