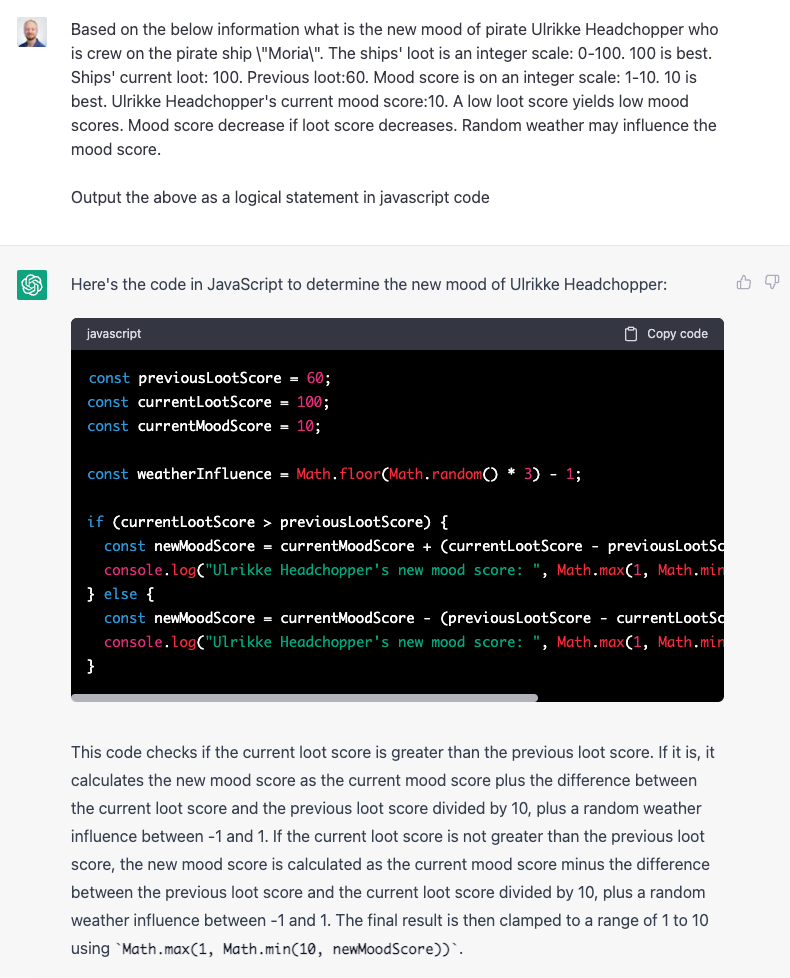
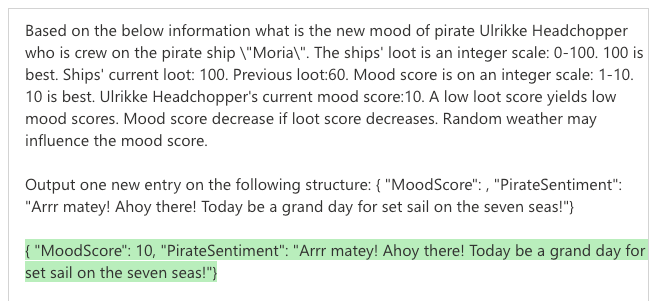
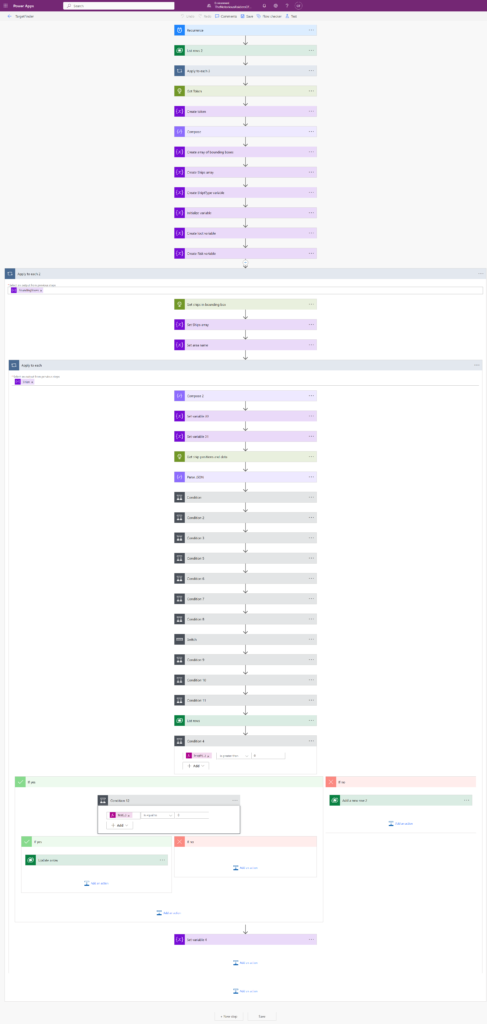
Travelling the seven seas is great fun and pirates can get as moody as anyone else. The ships current loot holding will continue to diminish in between raids and weather sickness can strike at any time. The below input is what we use to simulate mood swings, also output as logic in code.
Of course, we have no idea if this is the actual code or not, as we ask to get schematized JSON – sanitized for input into the dataverse. With mood data available we can start tracking if a mutiny is far away or close at bay.
We’re thinking the following badges apply:
The Existential Risk – text-davinci-003 has never looked better
ACDC Craftsman – documenting verbatim logic for the logical heads out there just makes sense, ensuring everyone can consume and understand the logic at hand independent of their skillset.
Dataminer – LLM are nothing but a huge heap of external data baby! We’re thinking Babels tower in blob.
When we’re creating an app for everyone one to use for their everyday Pirate activites coming from F&O, we might as well include som external data as well to make the experience for the Pirate even better. We have never, and never will, argue that you will get all the information you need every day from F&O, so we have given every Pirate a bit more data they can use every day in their canvas app:
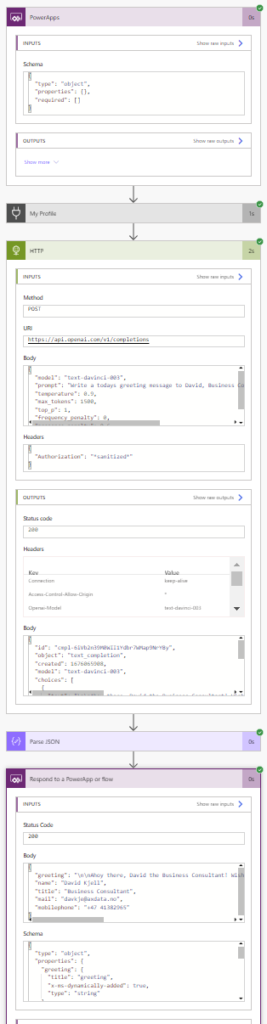
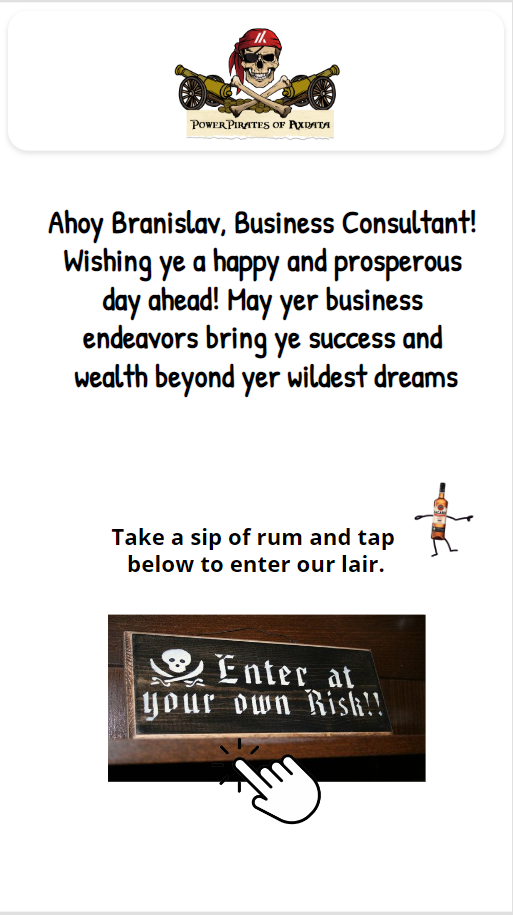
When you first log in to the app in the mornig, it’s handy to get a little greeting just “welcomming” you to a new day, right? We have created a PowerAutomate that uses OpenAI to find a new Pirate greeting just for you (if using AI to cheer up your Pirates isn’t an innovative use of AI, then what is?):
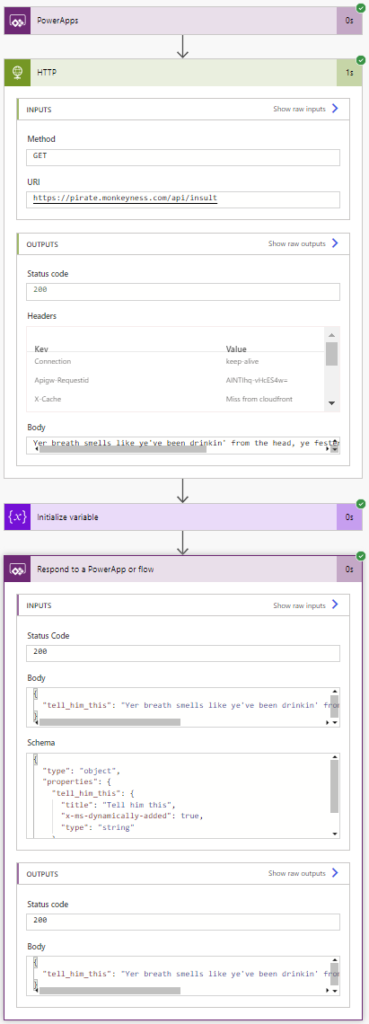
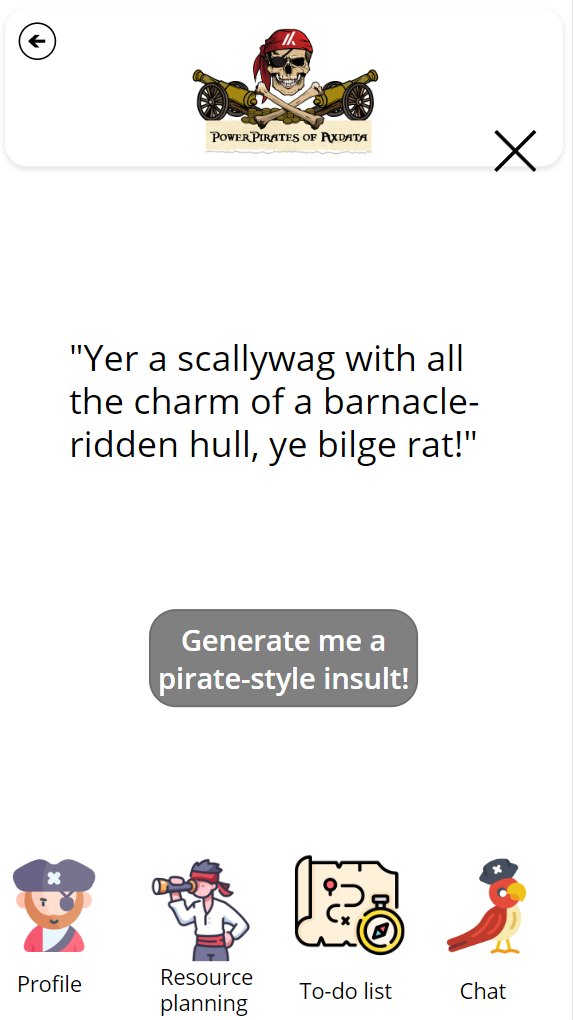
2. If you feel down, and just want some text to make you laugh a little, you don’t need to go to the internet, we have created an Insult of tha day feature in your app. Just click it and start feeling better, at least if you think that this insult is regarding you bunk-buddy 🙂
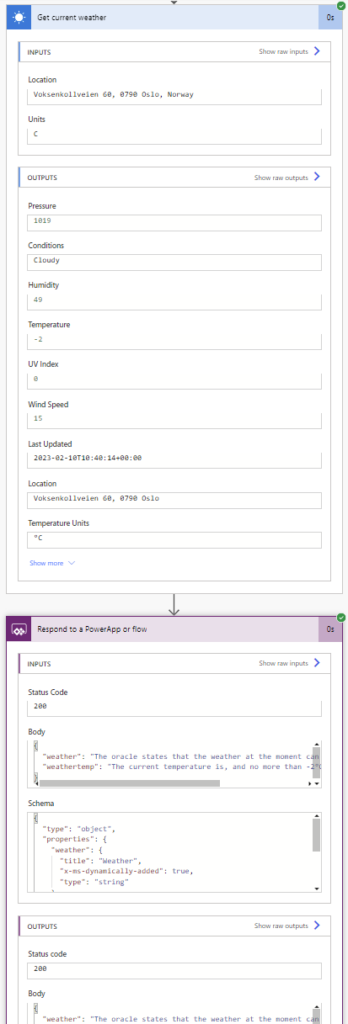
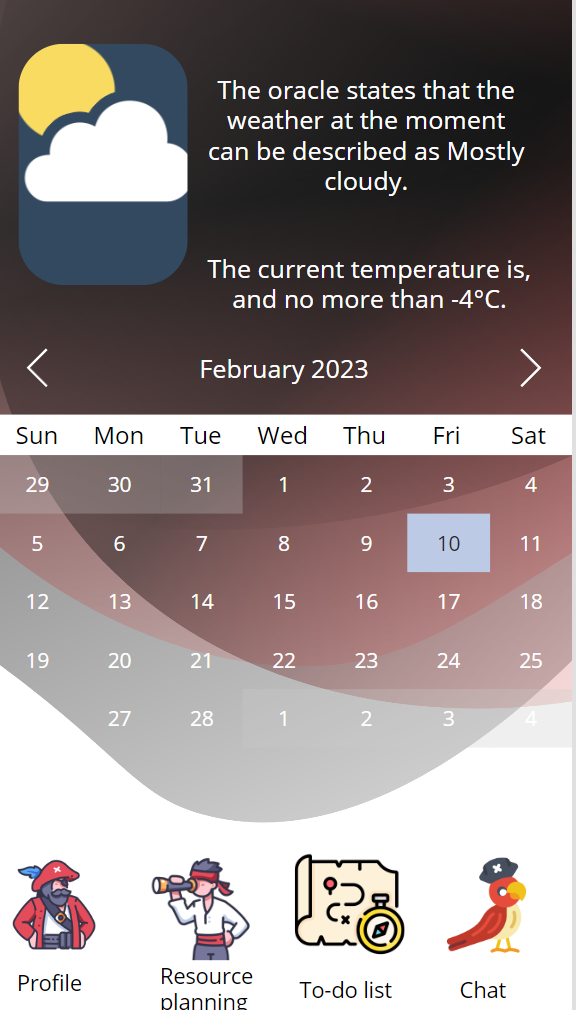
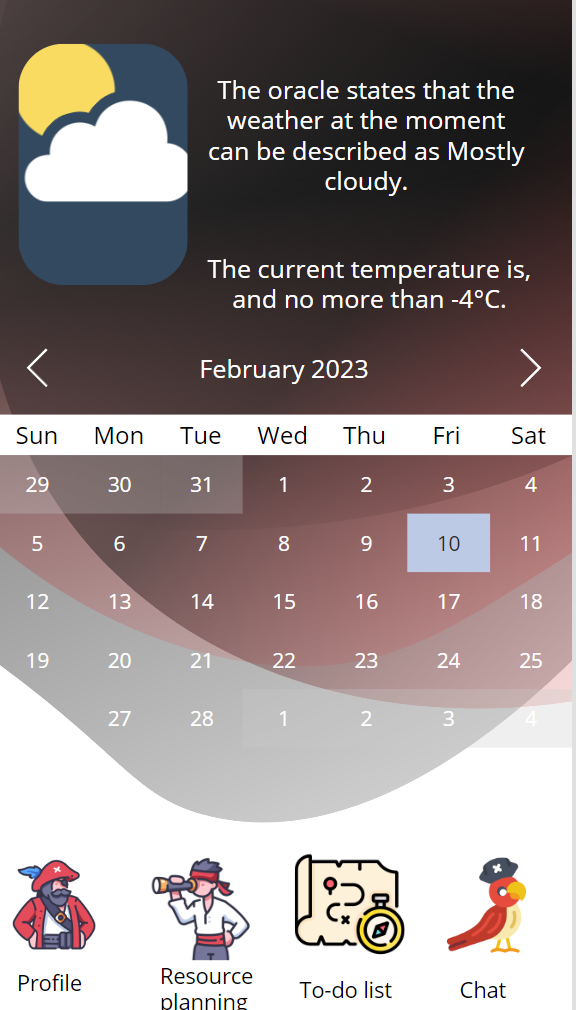
3. And then, if you want to know what kind of weather it is, look no further, it’s already right there in you Pirate app:
As we have mentioned before, our ship data comes from Kystverket. We expect high data quality and in the early days of pirating this was achieved by importing excel lists where the pirates had used much time to track down the ships in order to maintain accurate positions. Now this work poorly as the amount of ships has increased and the time used to maintain the lists resulted in ships sailing to the next city before we could even detect it. In other words, the ship had sailed. Therefore, we had to make a more efficient way to load the same data and keep it consistent with Kystverket. By using power automate we created a flow that contacts their api and fetches data from premade bounding boxes around the Norwegian coast. It deletes ships out of range and updates the location of those who remains. If new ships occur in our areas, they are created in Dynamics 365 and we will know!
By making the data collecting process more efficient for our pirates using data from other sources, we hereby claim the Go With The Flow and Dataminer badge!! Argh 🙂
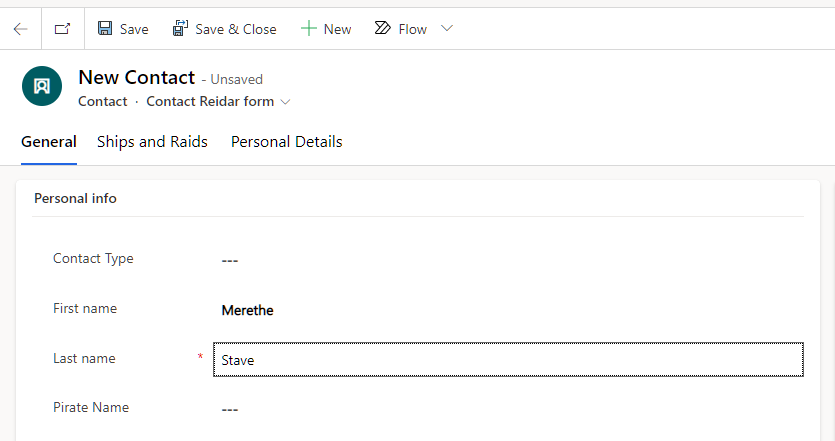
Pirates and singers are alike. They need a great stage name for people to remember who they are. When a new pirate arrives at the harbor master looking for work, the first thing they need to do is find a good name.
Just imagine what EMINEM would be if his artist name was Marshall Bruce Mathers III !!
The Harbor Master enters the new pirate to the system, and lets the AI tool decide what type of name suits the new pirate the best.
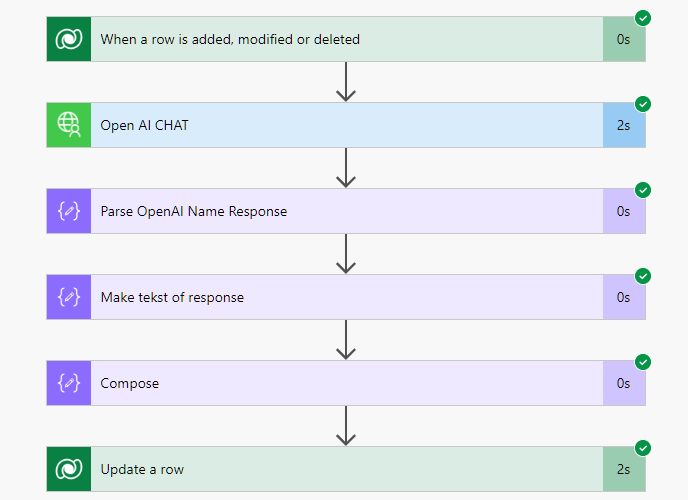
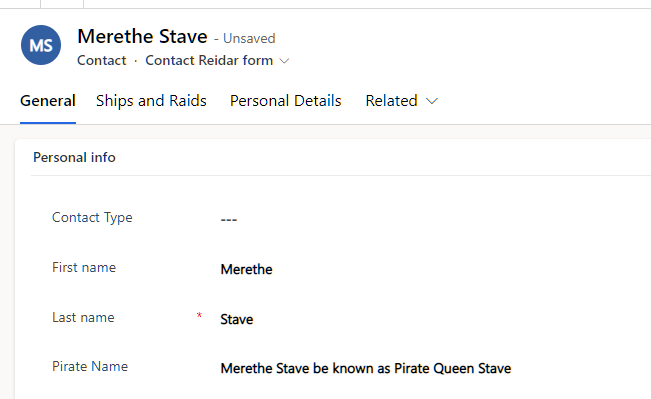
On the save, a Power Automate fires off a querry to OpenAI via a custom connector with the querry “Give me a pirate name for *Full Name*”. The return is then entered on the contact card.
When you are a pirate, it is pretty usefull to know what kind of weather it is, right? And, when you first have your own Awesome Pirate Corp. app, this information should of course be available here (we know, it’s cold to be a Norwegain Pirate right now!):
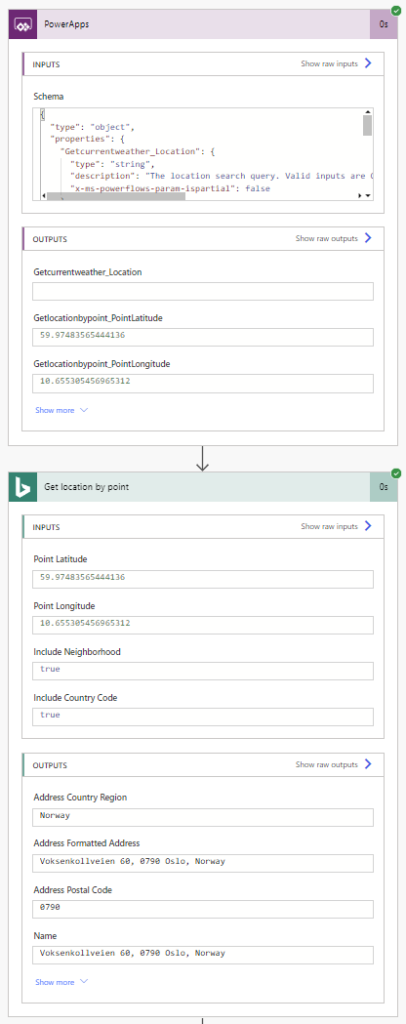
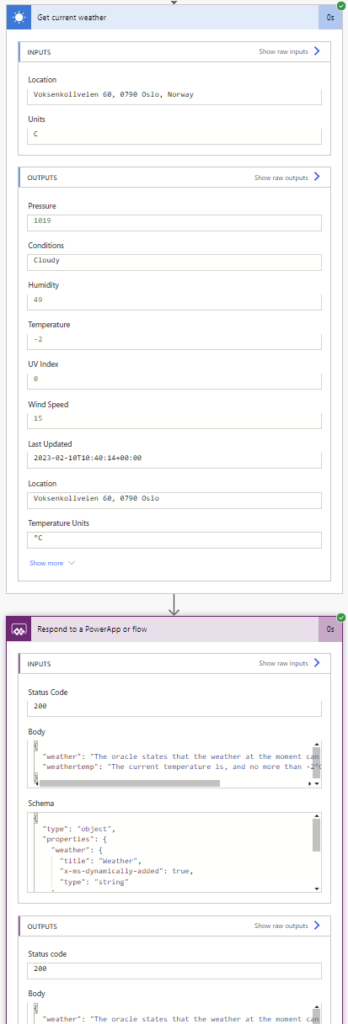
To do this, we created a flow that gets your location data when you use the PowerApp, goes out and gets the weather where you are, and pushes it back to the PowerApp to show you:
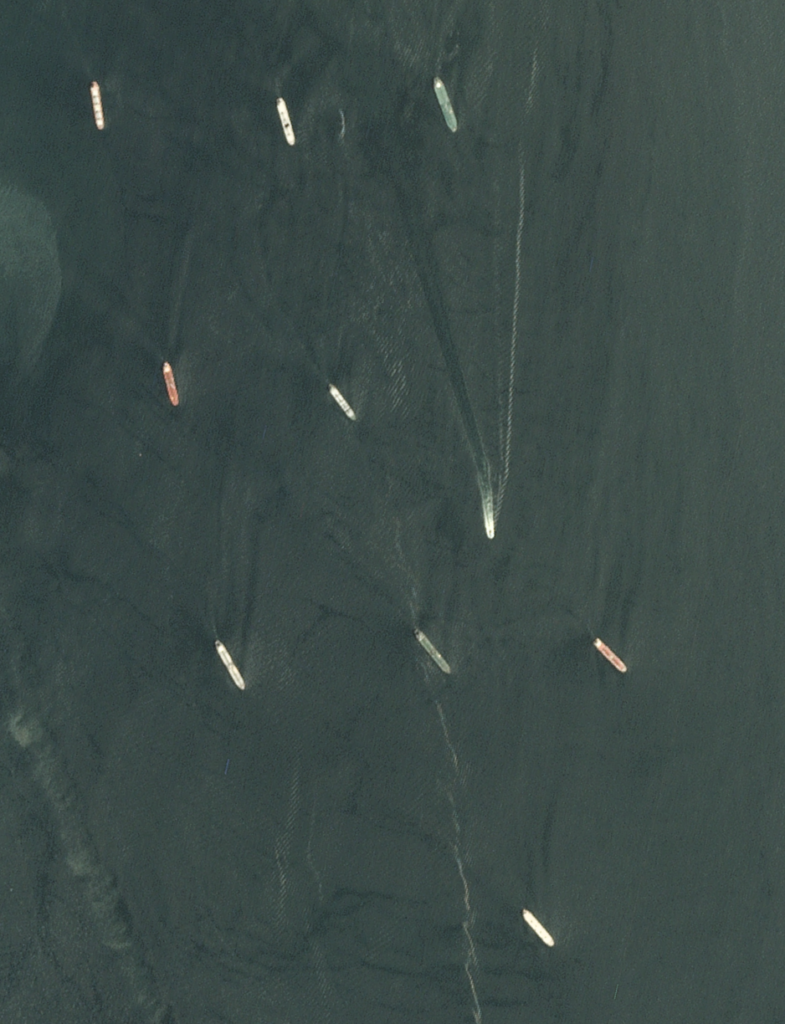
We get satellite images from the Sentinel Hub API where we can get images from the coordinates we want. This makes it easy to compare images with AIS data from the same time period and coordinates.
Sattelite image of shipsCounting ships
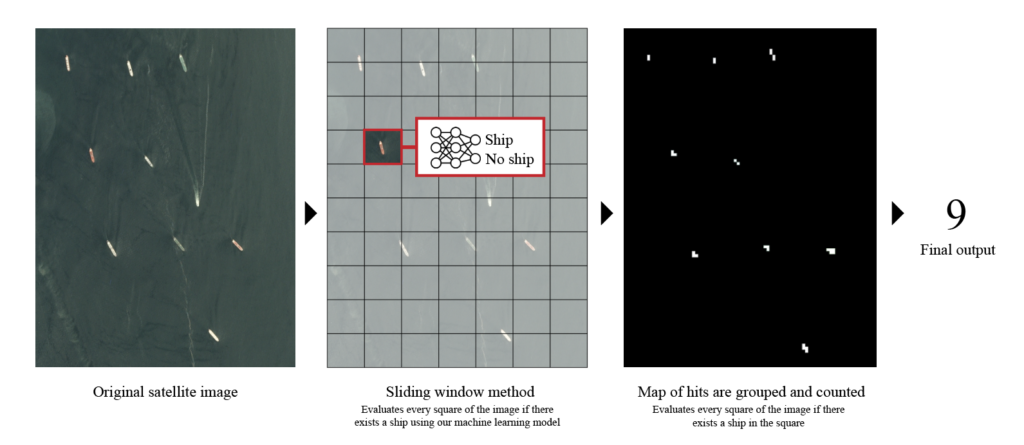
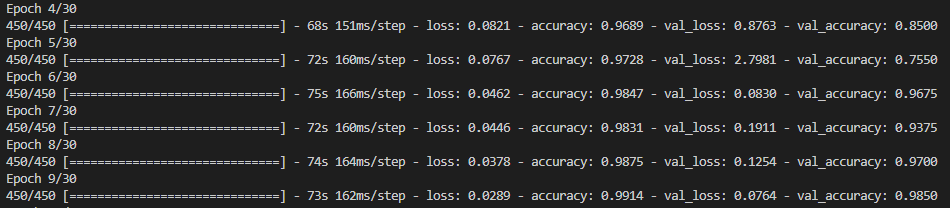
To identify ships from the satellite images, we need more eyes than we have available. So what’s better than letting the machines do the work. We have developed our own ML code in Python to recognize ships. This will make it much more efficient than manually reviewing all the images. Currently, the machine has 99% confidence in recognizing ships. It then creates a heat map that shows where it thinks (with 99% probability) there are ships. Then it counts the number of ships and sends it on.
Training the model to gain confidence
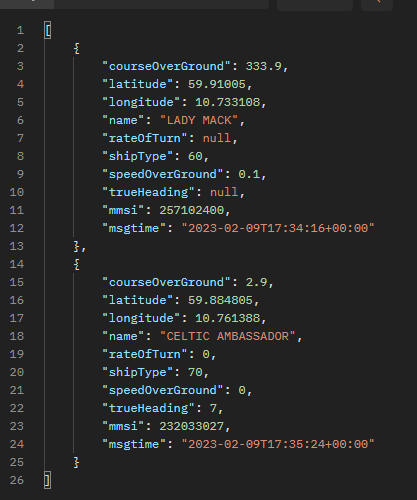
When we know how many ships are within a given area at a given time, it is easy to compare this with data from AIS. Here we search through the API of the Norwegian Coastal Administration, where we can count the number of ships within the same time and area.
JSON from AIS data
Using external data in this way provides great value for our customers as the threat at sea is significantly lower 💾🏴☠️
The reason we are calling this the jackpot app because we believe that it’s hitting multiple score-points!
The idea of this app is to enlist pirates’ fleet without a single character punch!!! Aided and infused by AI Builder, external API’s and Power Automate Flows; this Power Apps canvas app is state of the art geekiness!
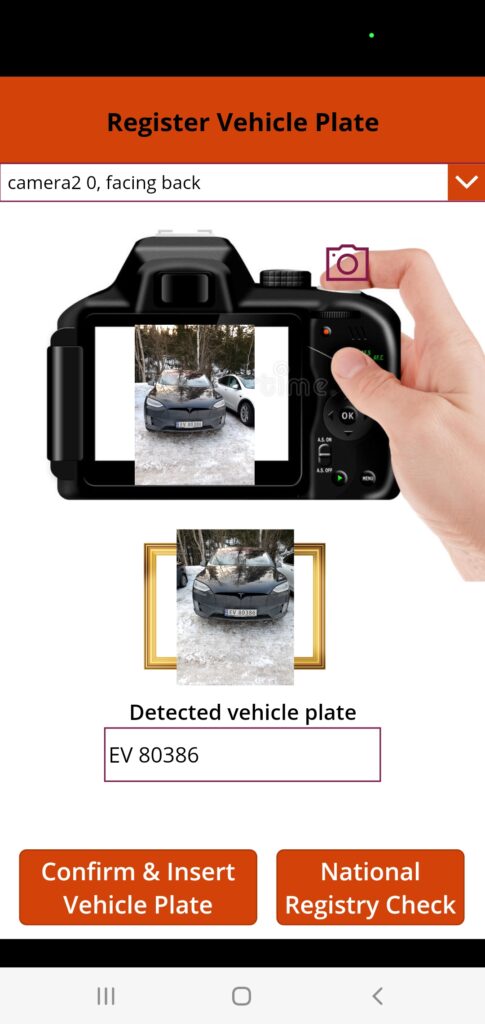
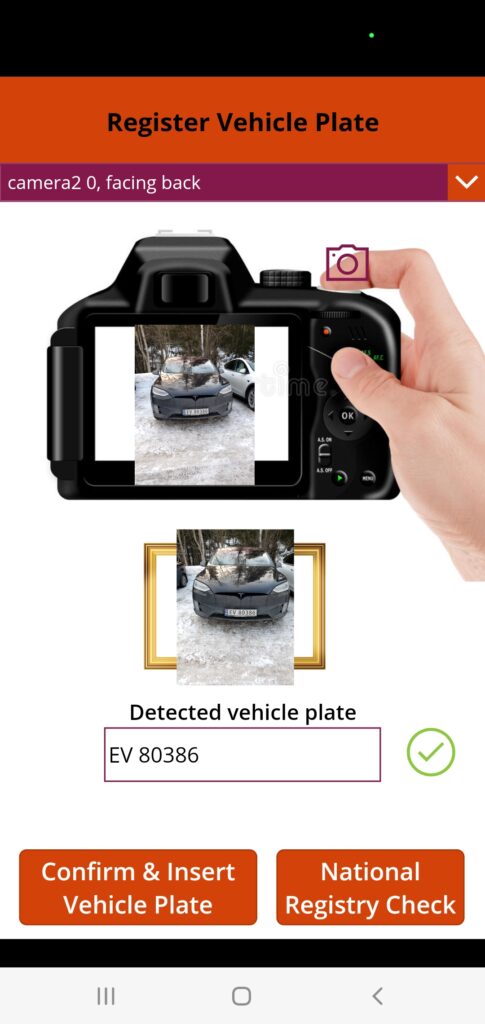
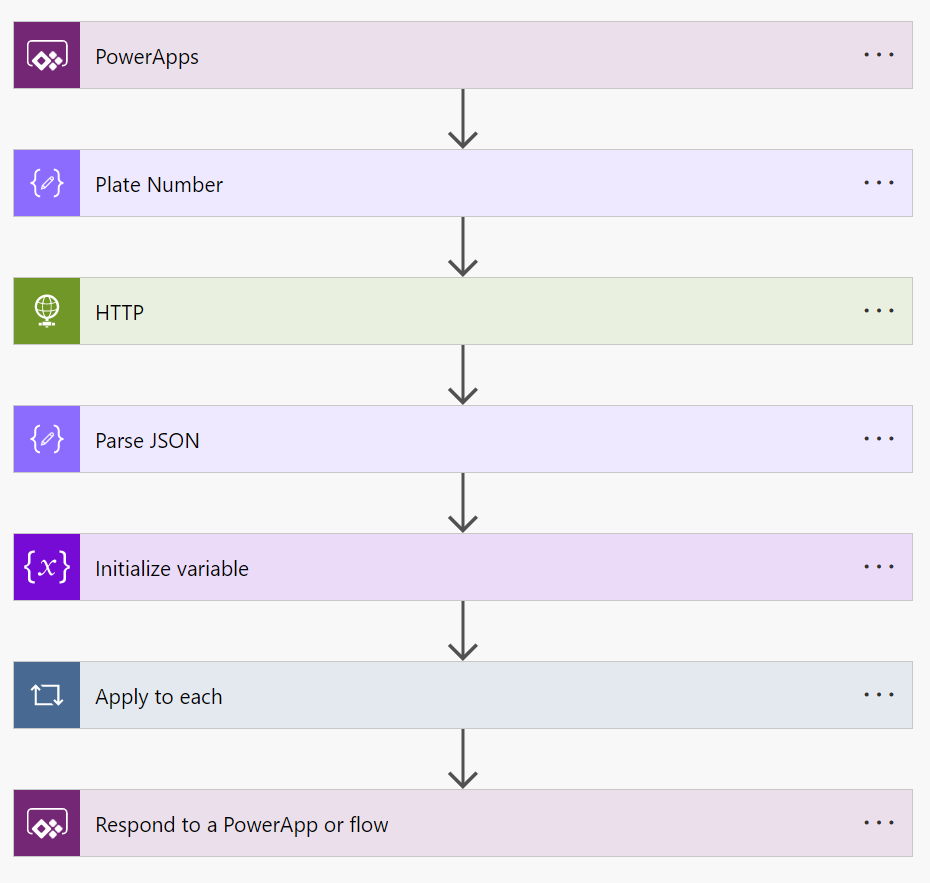
Although, registered vehicles are the last of our worries (as pirates), but hey we thought of doing it anyways 🙂 The app starts by taking a picture of the registration plate of the vehicle. the app will send the picture to the AI Builder through a power automate flow that process the image and read the registration plate and show it on the app for confirmation.
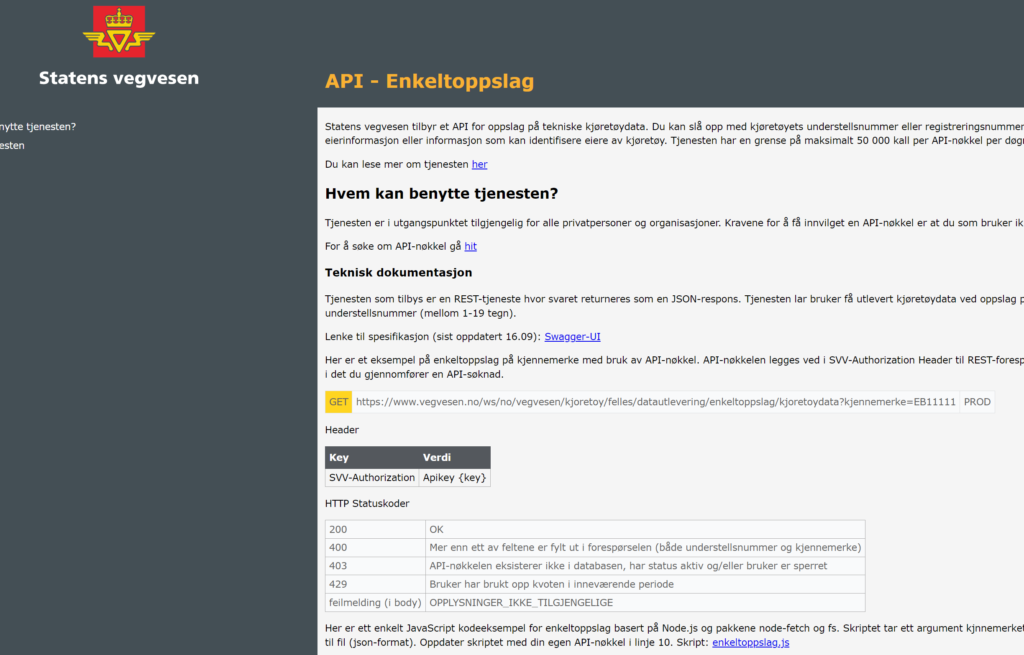
Once the you are satisfied with the result, you can check the vehicle against the national registry and search for more registration information. This indeed does check the car against the Norwegian car registry (Statens vegvesen) show if the vehicle is approved for going on the European roads (EU-godskjenning). Also least of our concerns!
Actual data from Statens VegvesenCrawling and datamining data from external sources
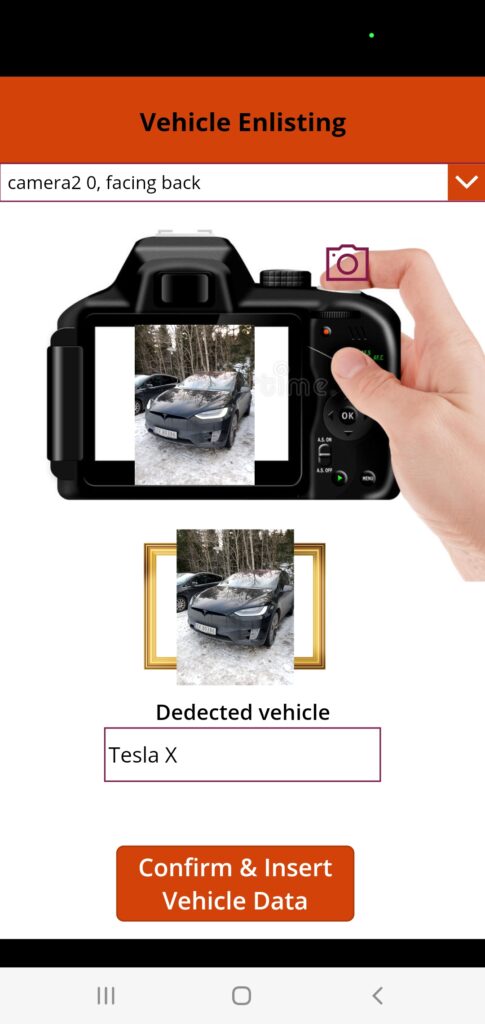
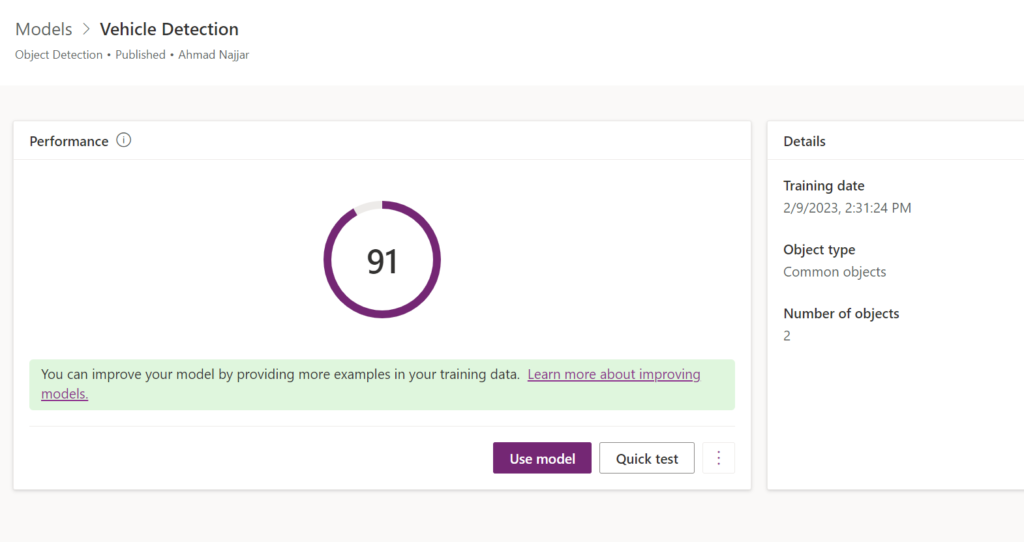
Now, after confirming and inserting car data into our system. We need to identify the vehicle type and compare with our collected data in our backend system. However, identify the care is a simple process that doesn’t need any text input from the user. One picture will do while the AI Builder will take care of identifying the type of the vehicle and insert it into our backend system.
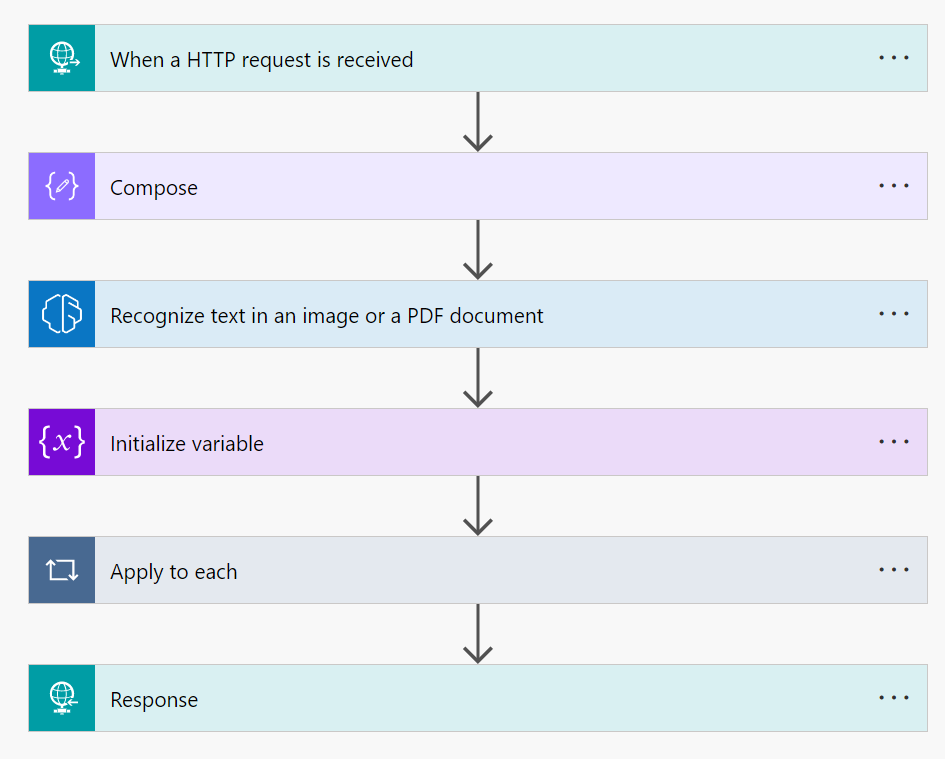
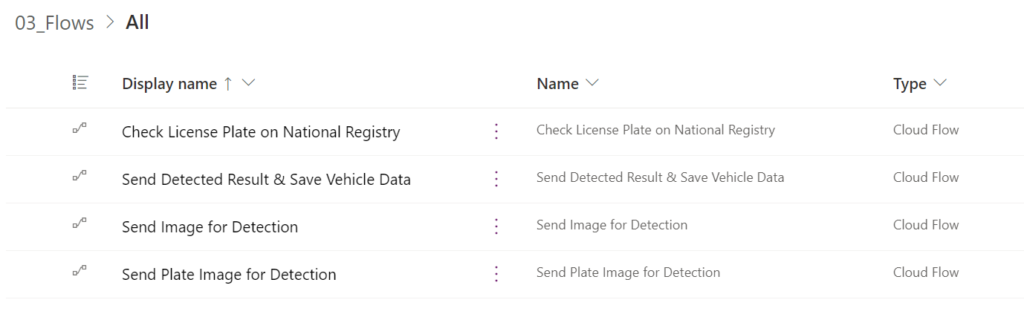
Vehicle plate identification flow (calls another flow through HTTP)AI Builder made as an endpoint (all AI Builder models and flow are on separate environment, as AI Builder can’t be included in a solution for deployment)
We are using a mix of built-in and custom AI models to achieve efficiency and productivity in an innovative way.
When first presenting our idea, the Hack Sparrows shrouded it in mystery. A battle tactic as old as the kraken herself. In the words of Sun Tzu: Never let you enemy know your plan, at least if you have one. Which we most certainly have…
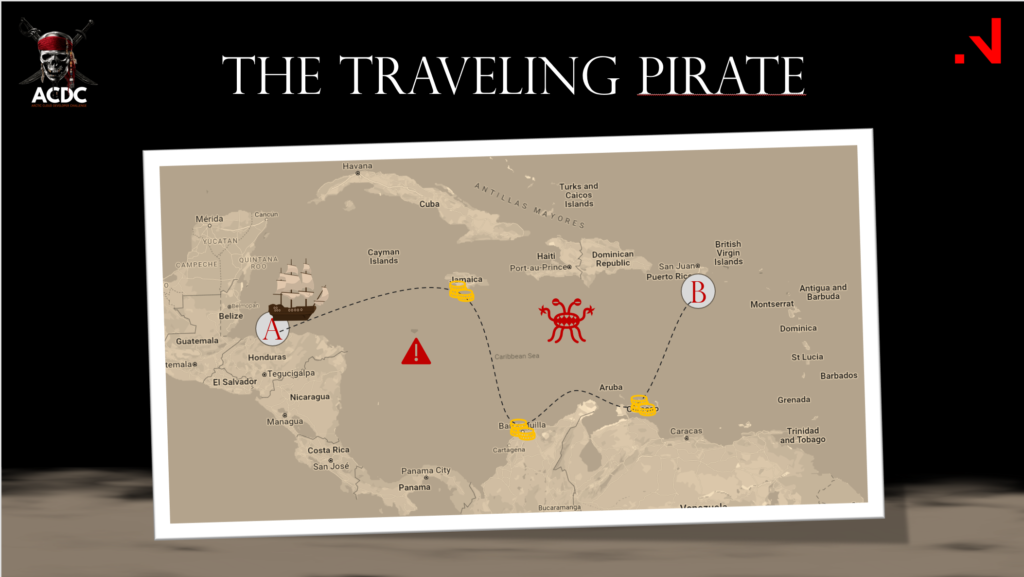
Initial sketch of what The Hack Sparrows wants to achieve.
The Traveling Pirate
Ever heard of the traveling salesman problem? It is a mathematical problem of route optimization: A salesman travels form A to B. In between he has many opportunities for trade. How can we optimize the route in terms of monetary value for the salesman: Which patch gives most bang for the buck, or most buck for the step?
The Bare Bones
We are no salesmen, we are pirates! And based on the presentation many of us are after the same treasures, leaving the best planned pirating rout the winner of pirates. The pirate king!
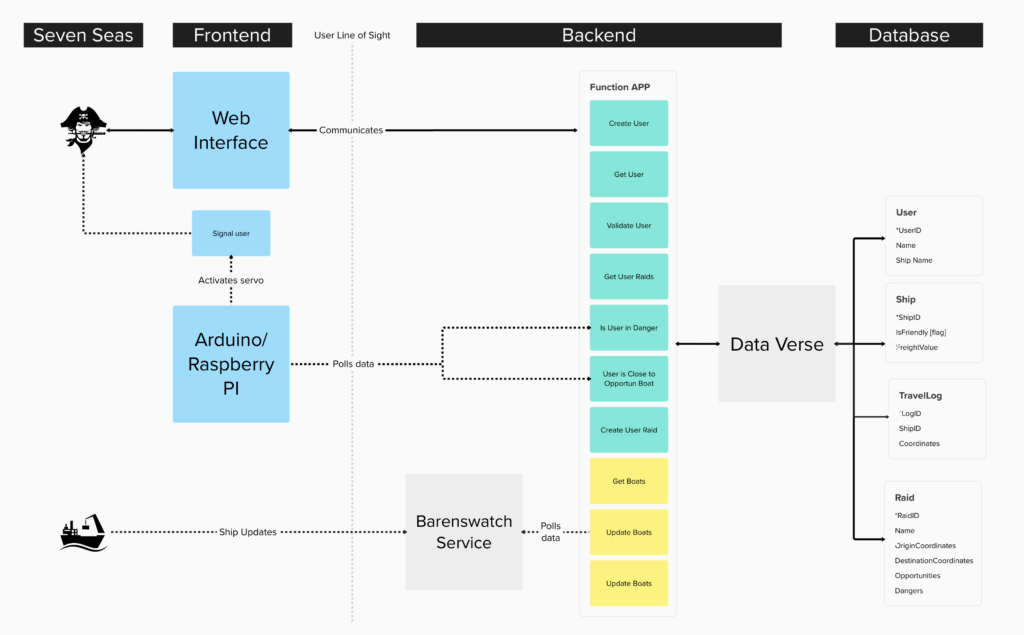
Our cleverly designed and thoroughly QA’d Architecture (do not double check) shows how we will use state of the (last century) art to enable better piracy.
System diagram showing what the user sees and what the system does. Proudly made with a thieved licenses from our employer. Yarr! (we have license, we just act like we stole them)
On the seven seas the captain has access to a web interface. This web interface uses a Function App to talk to two main services:
We data mine the Barenswatch.io service, which keeps track of all commercial vessels on the seven seas, including the Privateers. And store them in our Data Verse,
The Data Verse updates and stores the crawled data to keep track off ship movement, ongoing raids and opportunities (including flagging Privateers as hostile)
Outside the web interface we use tactile feedback systems powered by Arduino (or Our Raspberry Pi is we can get it working) to warn the user of dangers or opportunities.
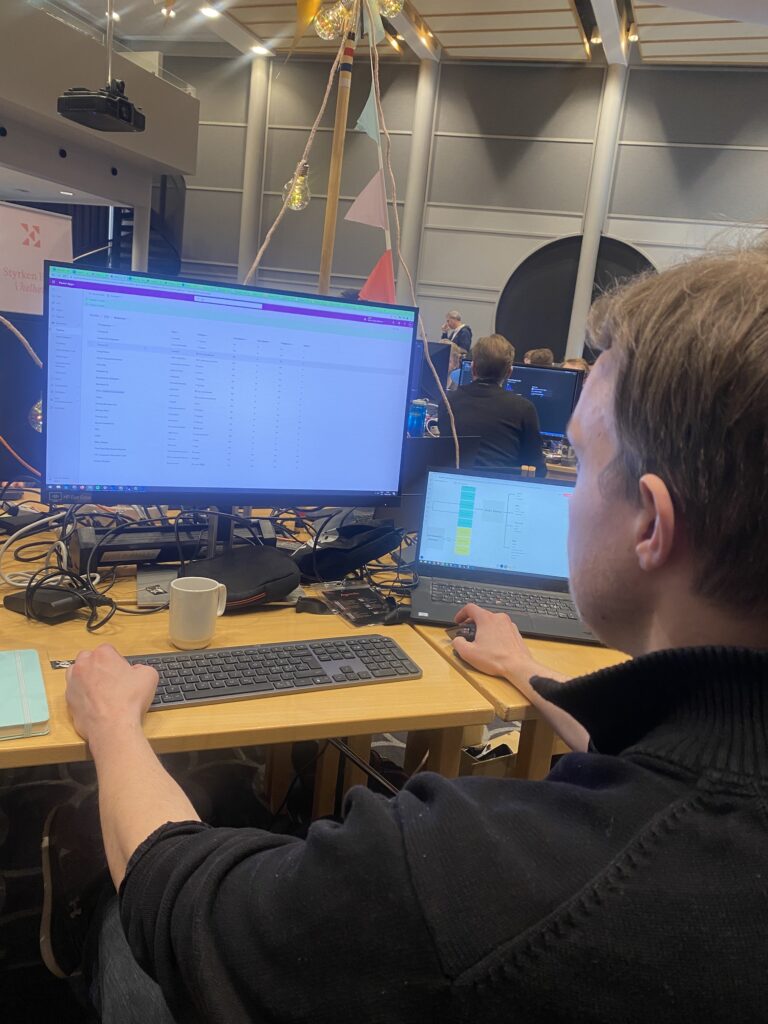
Henrik creating the Data Verse tables for the power platform that will give power to platform, empowering the pirats to pirate commercial platform vessels
We came into this Hackaton with the idea that we could make the Onboarding process a lot less manual, a lot more secure and reduce the risk of human errors in the process significantly. And we’ll be honest, we are extreamly happy with the solution we now are traveling home with! The best thing you ask? It works like a sharm, every bit of it! We have tested it several times, and everything flows exactly as described! You can see the full solution under here, but we’ll start with a summary of why we think we should get a lot of points in the four different main categories:
Excellent User Experience:
Lets start with the help this will give to the employees already working in the company: – HR now will have a veary streamlined process for Onboarding, where all tasks that can (and should be) automated are just that. They don’ need to spend time sending out agreements, follow up with signature, enter a lot of information regarding the new employee in the system, follow up on other employees that forgets the tasks they have in an Onboarding. They don’t need to notify IT about a new employee coming it and wait for creation of user and access to systems. All of this happens automatically. Nothing is forgotten, no sensitive information is sent in emails or seen by someone who shouldn’t see it. – IT never needs to think about a new employee coming in anymore. Everything is automated and just happens. Isn’t that the best user experience? When you actually don’t have to do even one click, and the process still works? – Other employees in the company having tasks regarding a new employee coming in will be reminded of their tasks and make sure nothing is forgotten. Automated and nice. And, if they complete their task, no notifcation will be sent, it really is as easy as it sounds
And then, to the candidate starting. If the company implements this solution, everything will be ready for the new employee when he has his firsgt day of work. He can even get information about the company, his team, his manager and more in the Onboarding Portal before he starts, so we can keep up the good energy people feel when they are about to start working at a new company. The new employee will also feel that this company really takes care of their employees, and that they really are up to date in the digital world we’re living in.
Most Extreme Business Value:
The value for companies here are so high, that it’s almost difficult to know where to start. But, first of all, this saves a lot of time for the HR department. And, we really mean A LOT of time. Not just that everything is automated so they don’t need to do as much as they have to now to register a new employee, but they don’t have to push and follow up everyone else that hasn’t done their part and they don’t have to correct human errors that’s been done during the process. They can spend their time on something that is much more valuable to the company, and that is to make sure that all the employees already working here gets the best environment possible to do their job as best as they can! Lets face it, this is what we want the HR department to do, we don’t want them to spend time on entering data into a system. The IT department will also save a lot of time witht this solution, that they can spend on other things as well. Not that I work in our IT department, but I assume that creating users and assigning licenses and access aren’t the most fun task they do at work. So I would think this will actually make their workday more fun! Let’s just do an approxemently calculation of time saved. Create a contract for the new employee, upload it for e-signature, send it for signing, recieve it, ask the employee for more information so that it can manually be put into the system. Let’s say this totally takes 5 hours at best. Then someone needs to tell IT to create user and access and make sure that it have been done, a total of 1 hours. Then someone needs to follow up other employees, to make sure everything is done and ready for the new employee. This is maybe the most time consuxming, and I don’t think it’s wrong to say that this takes at best 8 hours in total during the time between someone signs and their first day of work. This means that time saved for just this one onboarding process is at least 14 hours. One of our customers typically hires between 10 and 20 employees every month, and this means that this solution will save them between 140 and 280 hours. Each month! To have an other example, an other customer of ours plans to hire 1.500 employees by the end of 2023… You do the math here!
Rock Solid Geeknes:
There are so many partws in this solution that works perfectly together, we almost can’t believe that we actually made this work as good as it does now. We seriously din’t think that we would be able to automate that many parts of the process as we have done now.
Killer App:
We have created this as a total solution, so that everything can be uploaded and used by all companies using Dynamics FO og Dynamics HR. With only a little personalization to make the wording, logo etc. fit the different companies, this can be set up quite fast. And, of course, each part can be implemented by it’s self too, if someone don’t want the whole solution. But, we know that this will be an easy solution to sell to our customers, as we know that a lot of them already really wants this!
The solution:
And now, finally, let’s go to the solution. You have been through a recruitment process in your company, and you have picked a really awesome candidate you want to send an offer to. This is what you do:
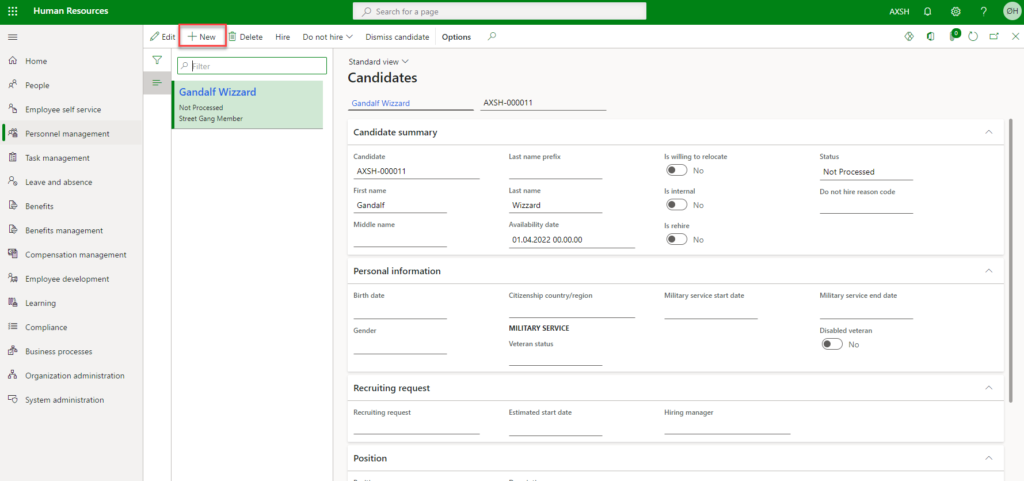
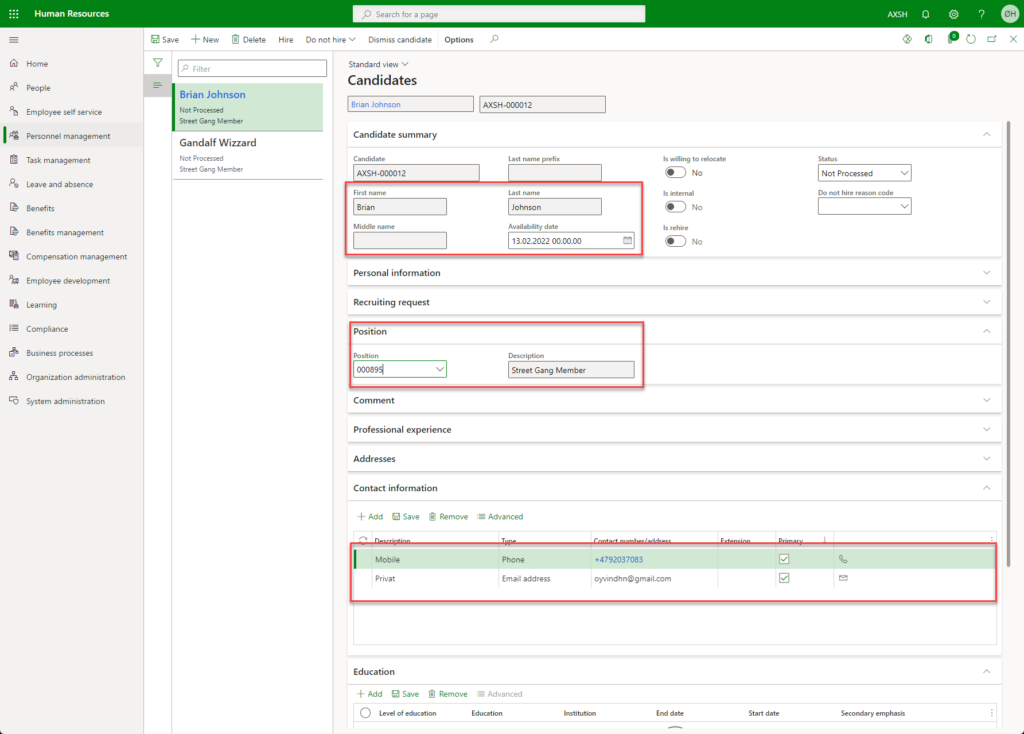
1: Create the candidate in Dynamics, and fill name, startdate, email address and phone number, and connect him to the position:
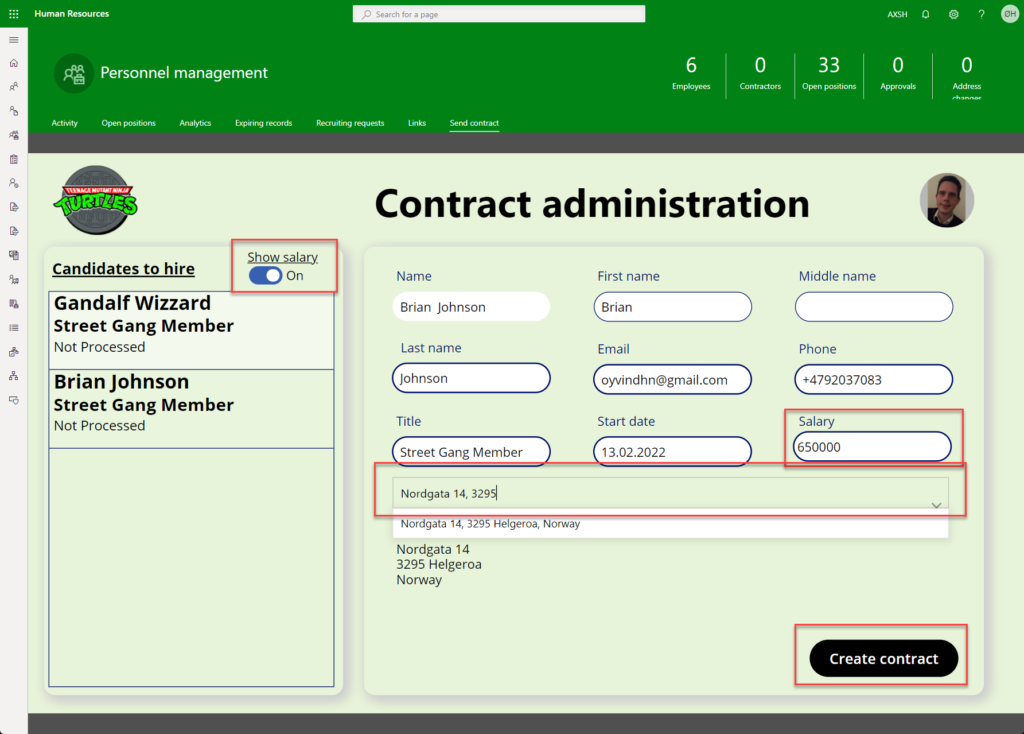
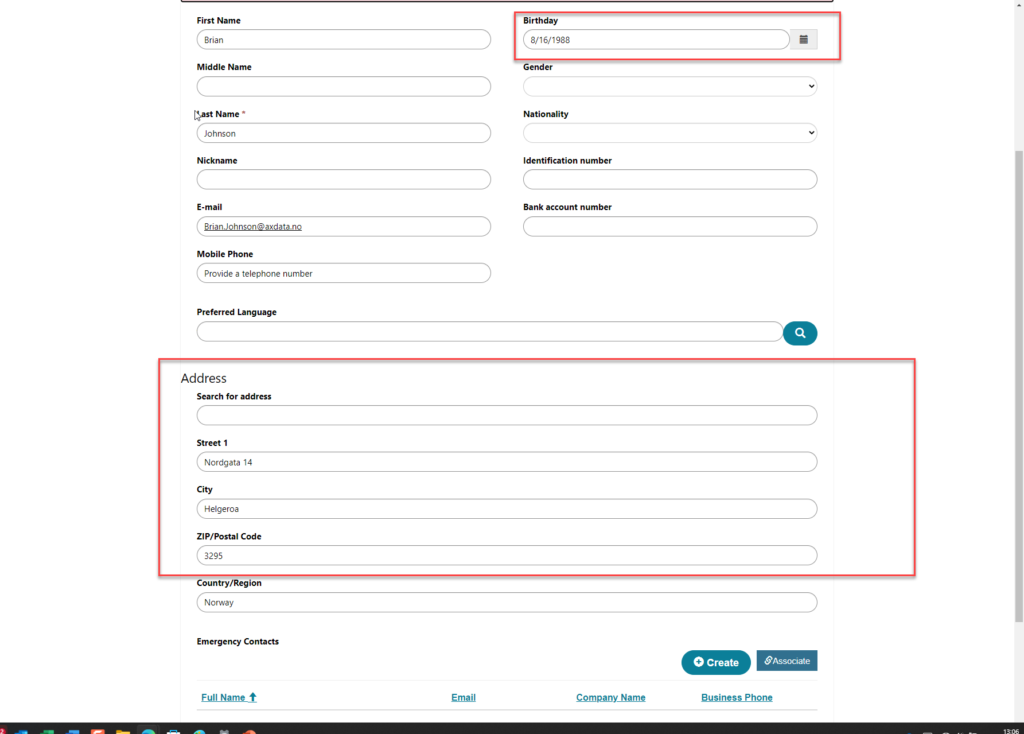
2: Use the App we have embedded in the Personal Management workspace to send an Employment Agreement to the candidate (for Dataminer and Crawler, we have here used GeoAppify address lookup to autocomplete adrees input from search):
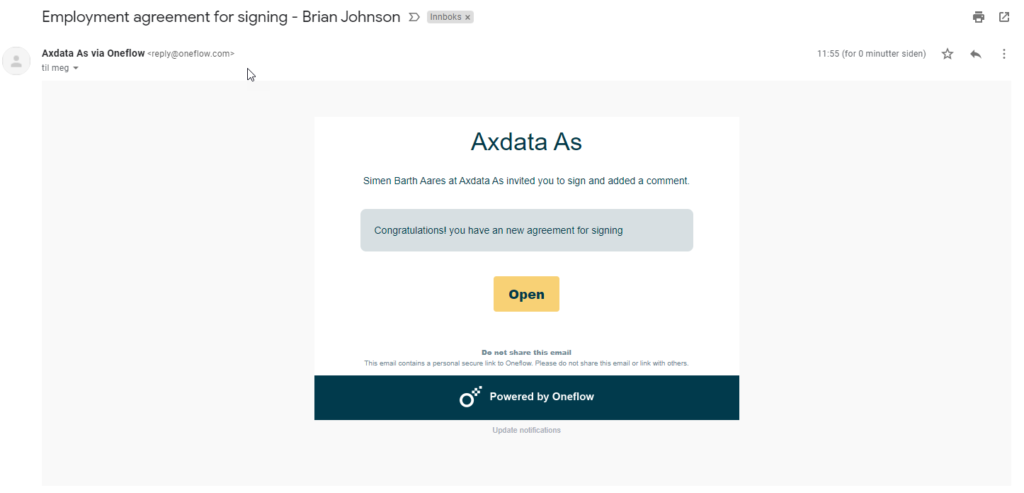
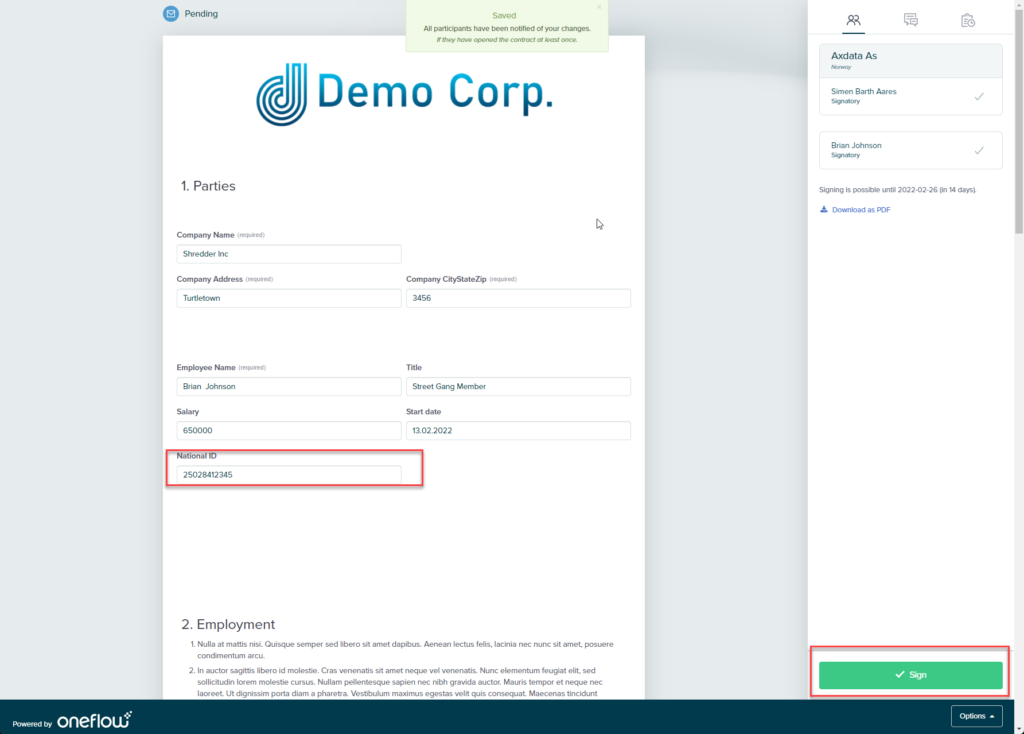
Like magic, the candidate resieves an email to view, update and sign the agreement. The Agreement is automatically filled with data from Dynamics before it’s sent out for signing, done through an API we created with OneFlow right here at this Hackaton:
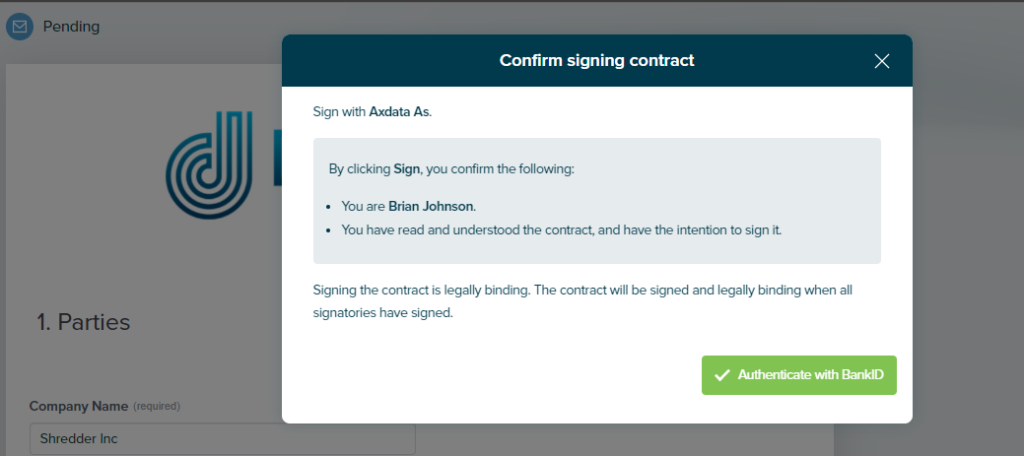
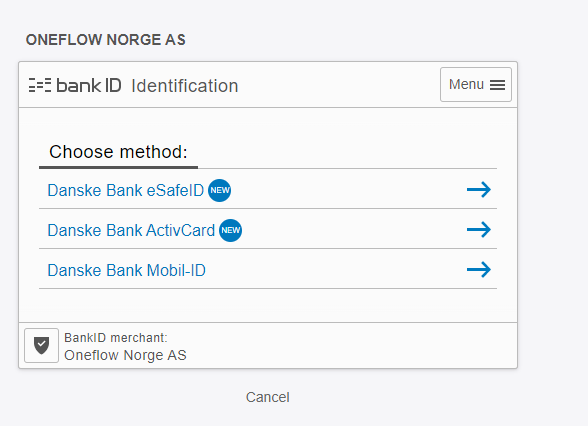
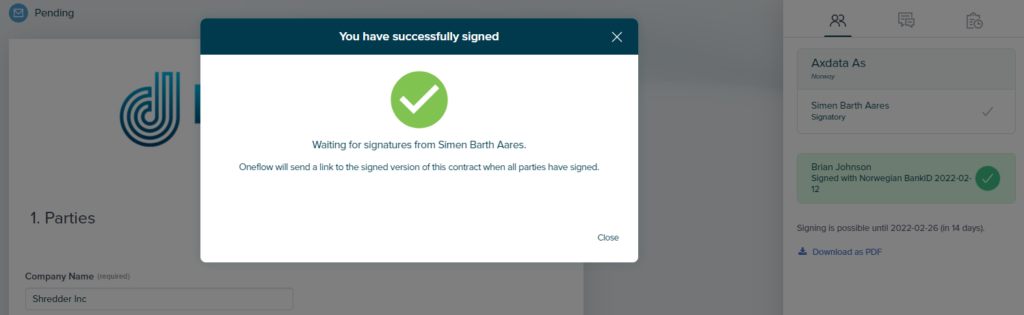
The candidagte fills in the National ID number, and signs the Agreement using Bank-ID:
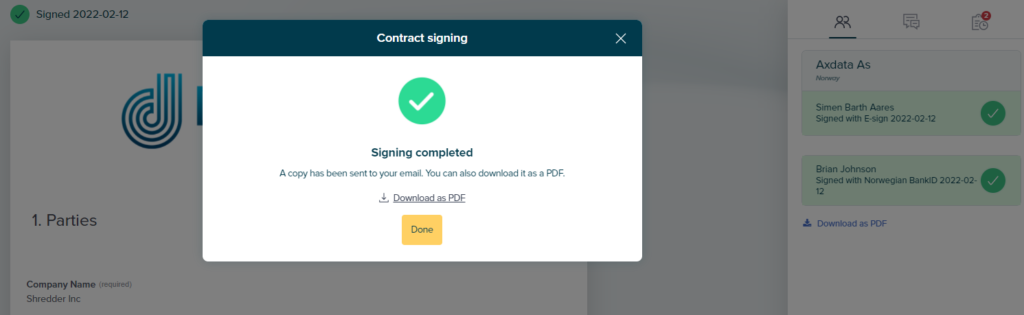
3: Agreement is signed by the company as well:
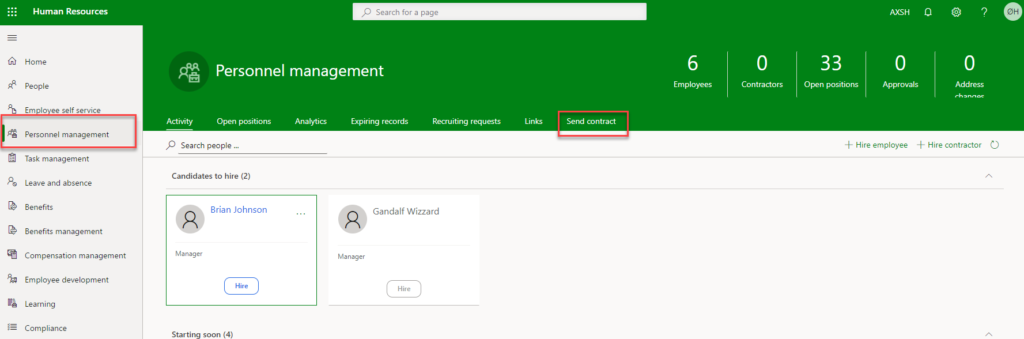
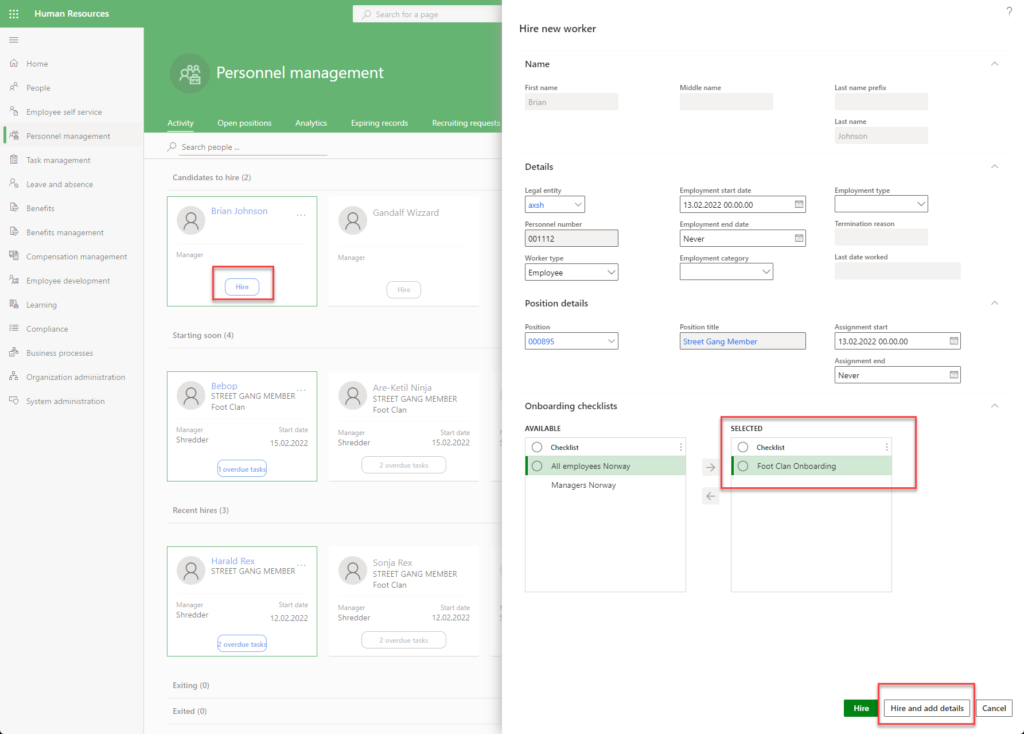
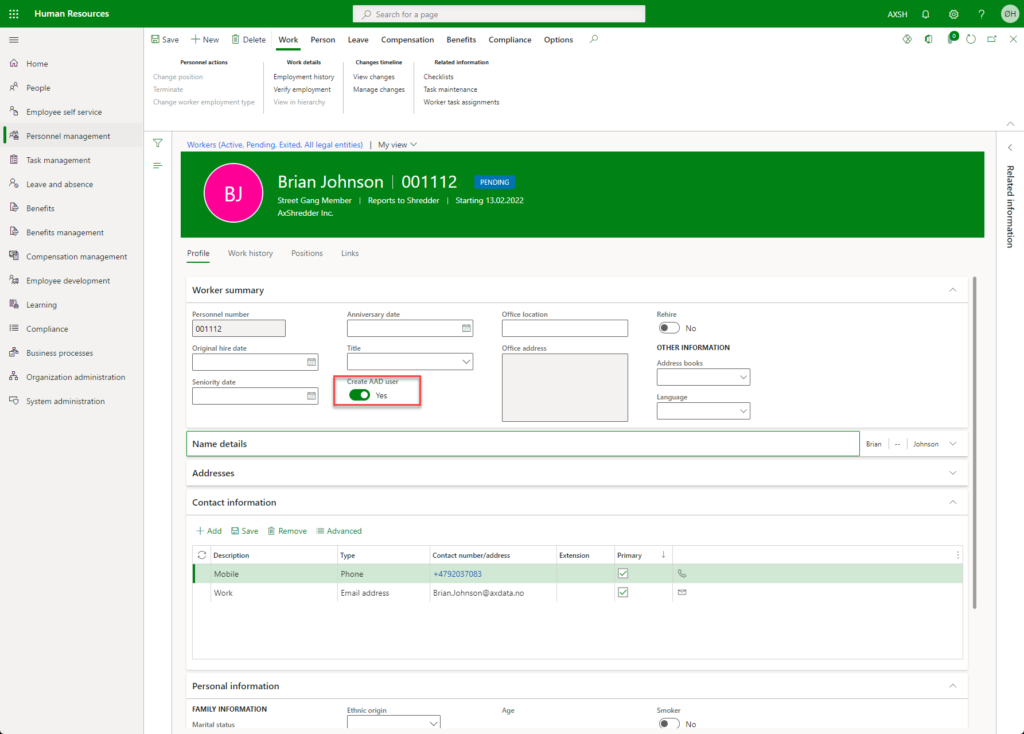
4: You Hire the candidate in Dynamics with two clicks, and assign the onboarding checklist that should be used for this canidate, and ticks the checkbox to create a user in Azure AD for the new employee:
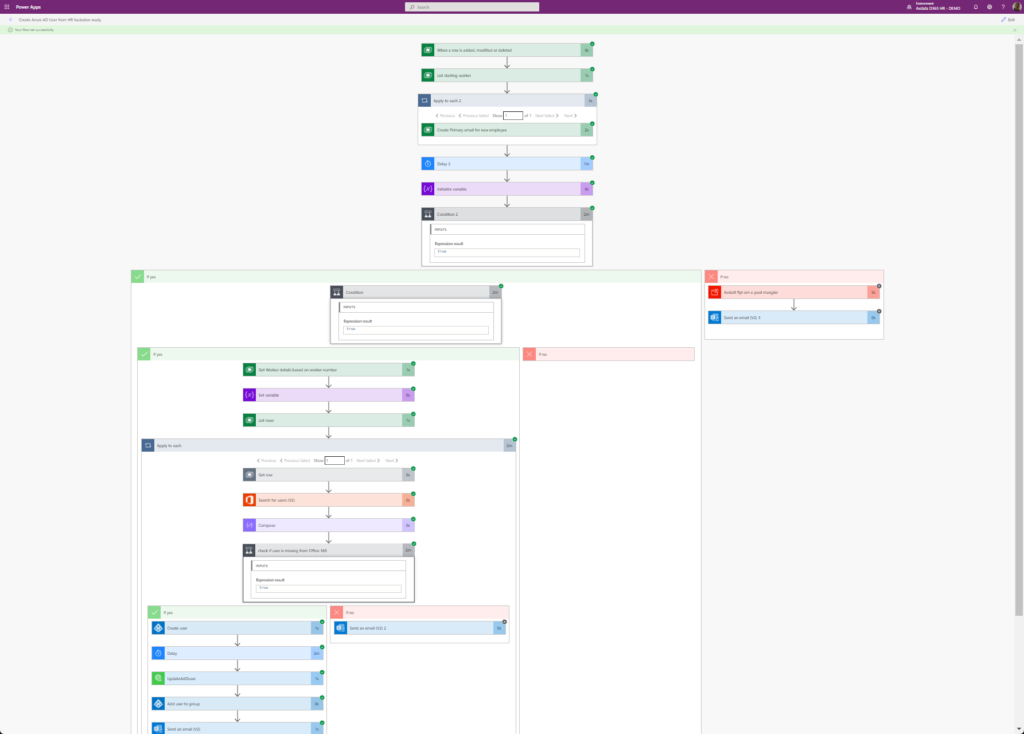
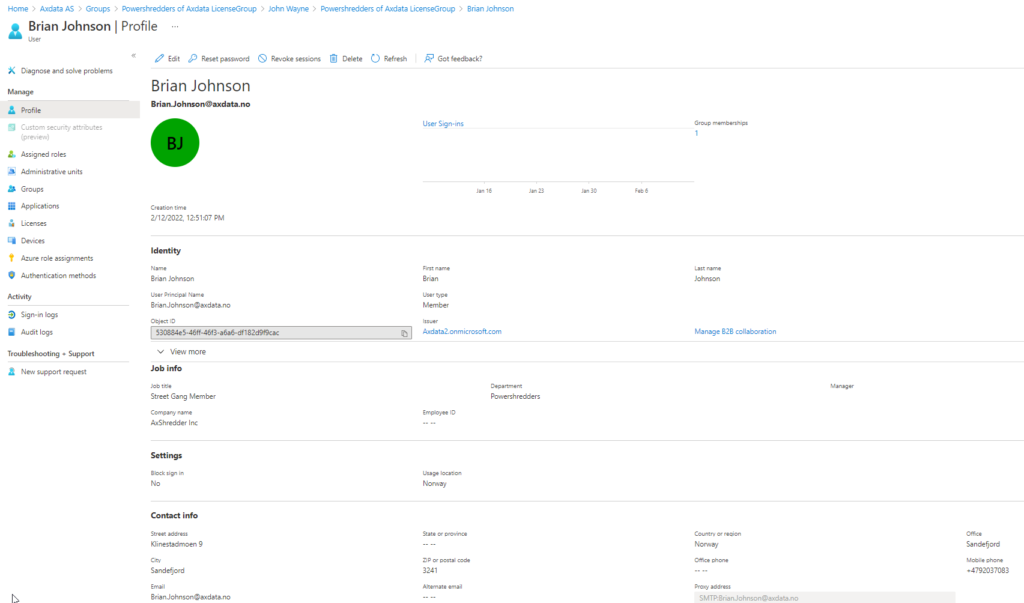
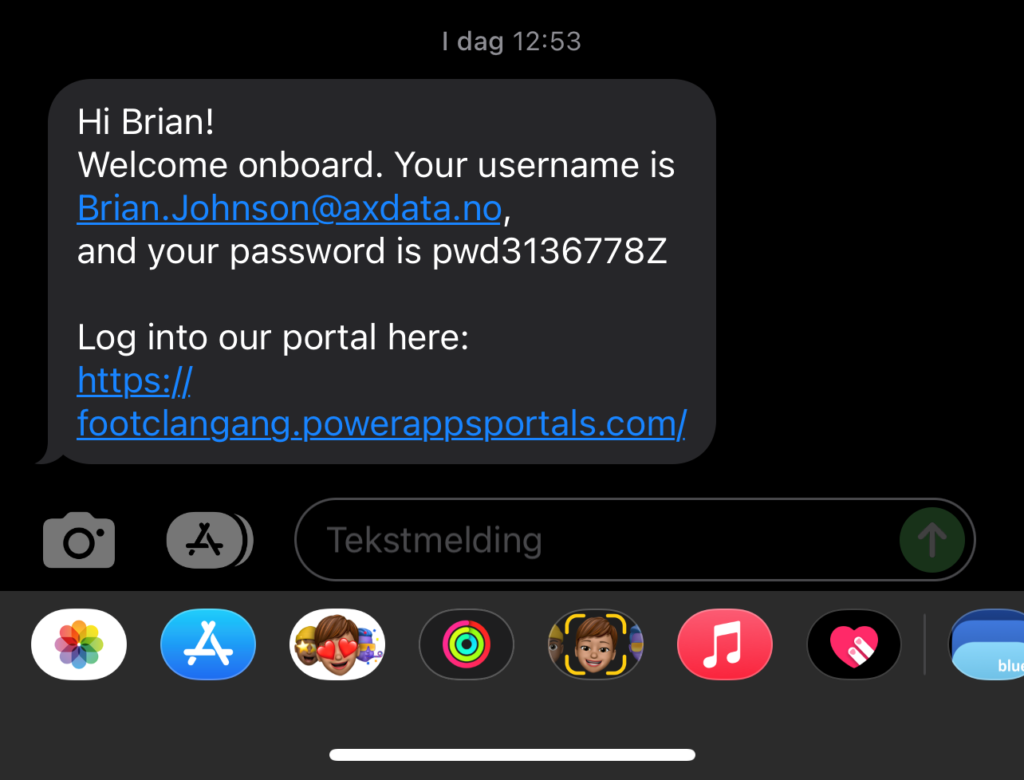
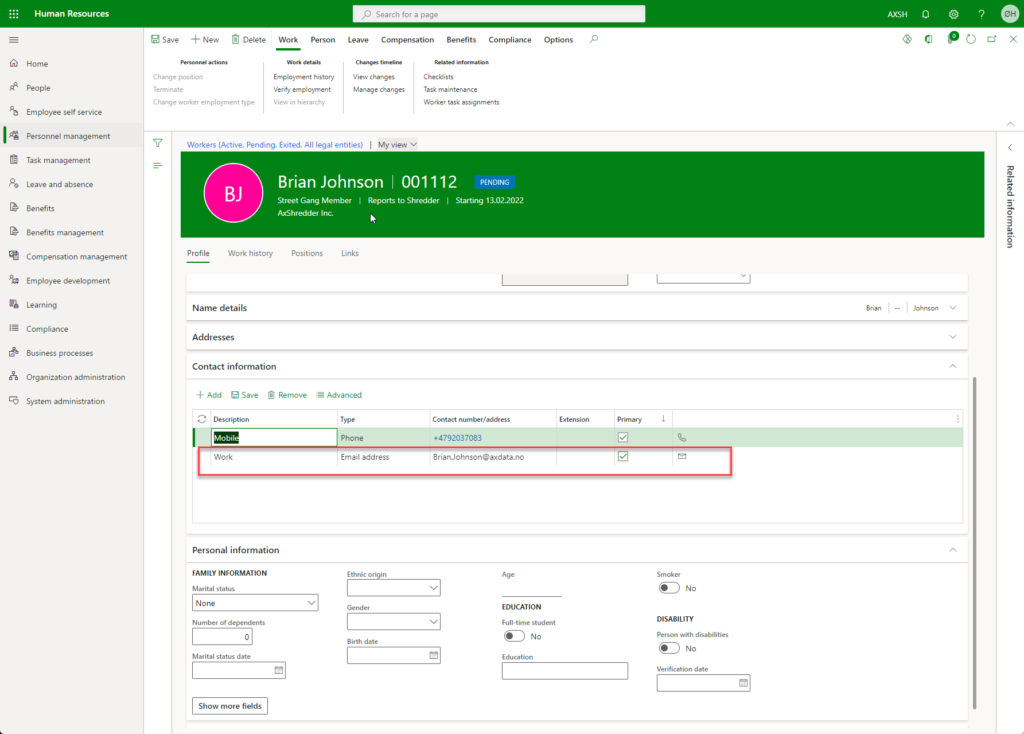
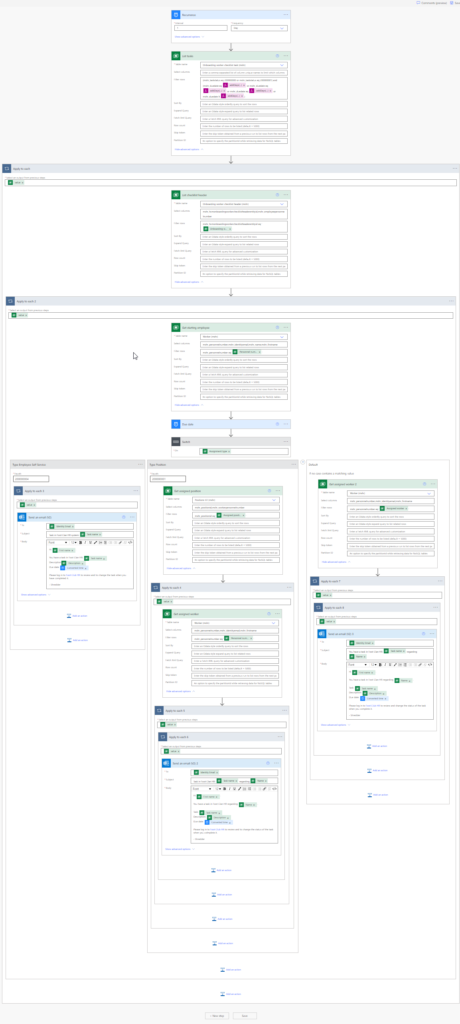
This triggers a PowerAutomate that first create a work email for the new emplyee, sets this new email as the primary email address on the Employee workspace in Dynamics and creates the Azure AD user for the new employee and assigns group and licenses to it, and ends with sending the login detail to the employee with SMS, together with the link to the Onboardig Portal:
And, of course we have created a PowerAutomate that will remind the employees in your company about the tasks they are assigned regarding the onboarding of the new employee if they don’t follow it up by themself:
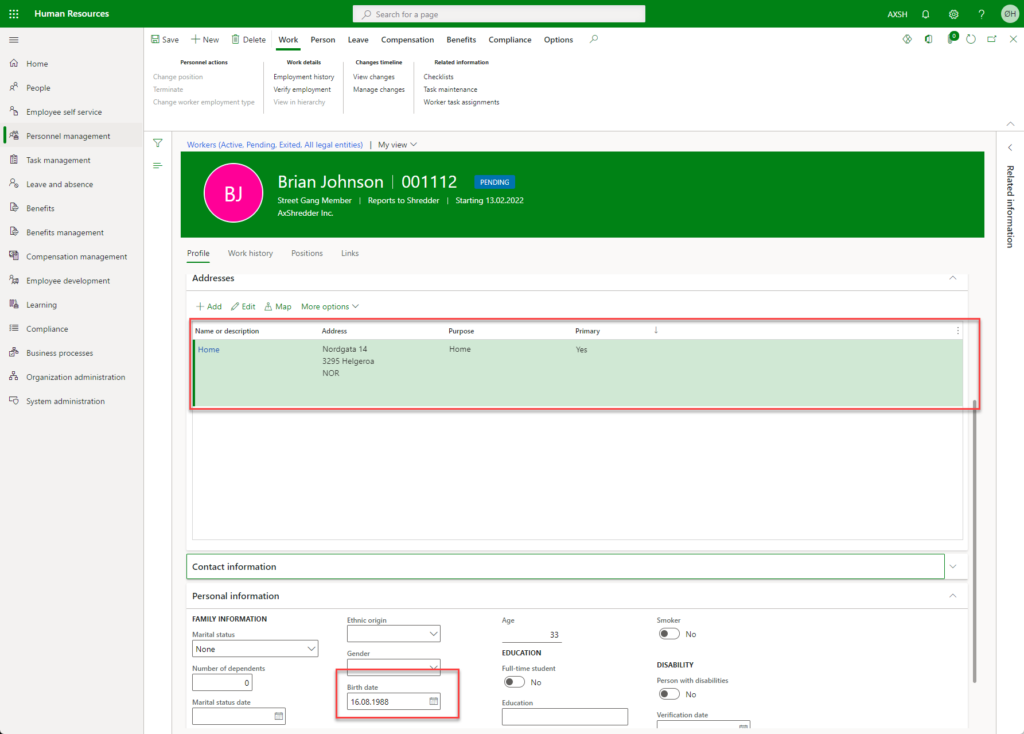
Now, the employee can log in to the Onboarding Portal (that works on all devices), and enter in more information about himself. When submitted, the data is automatically updated directly in Dataverse, and then becomes visiable in Dynamics within seconds:
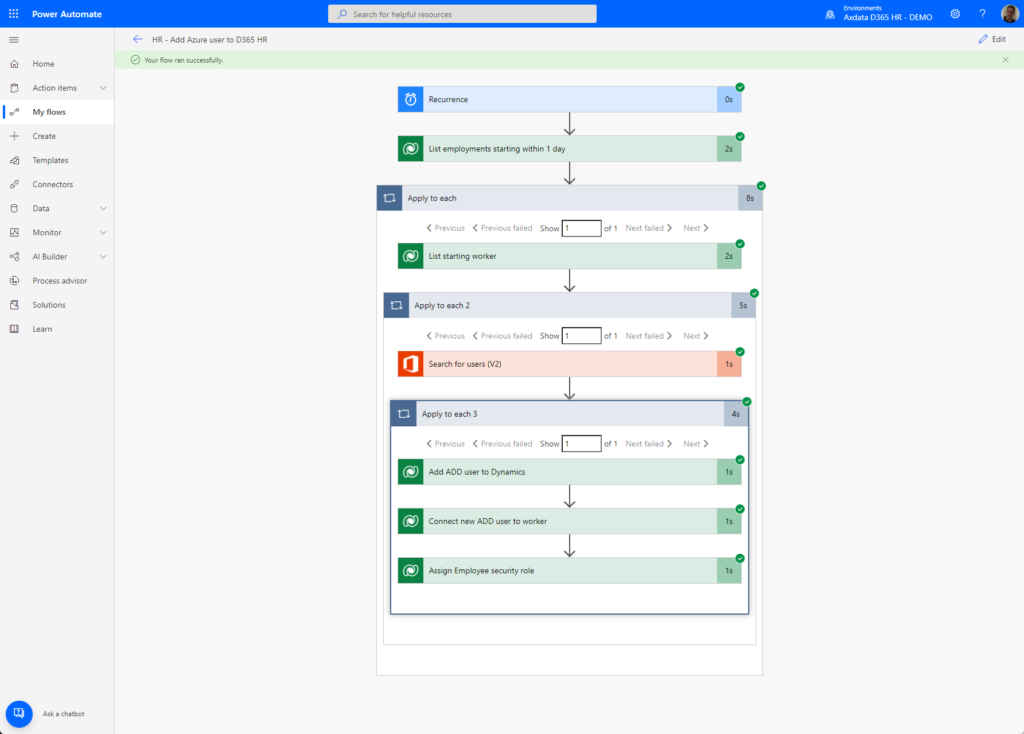
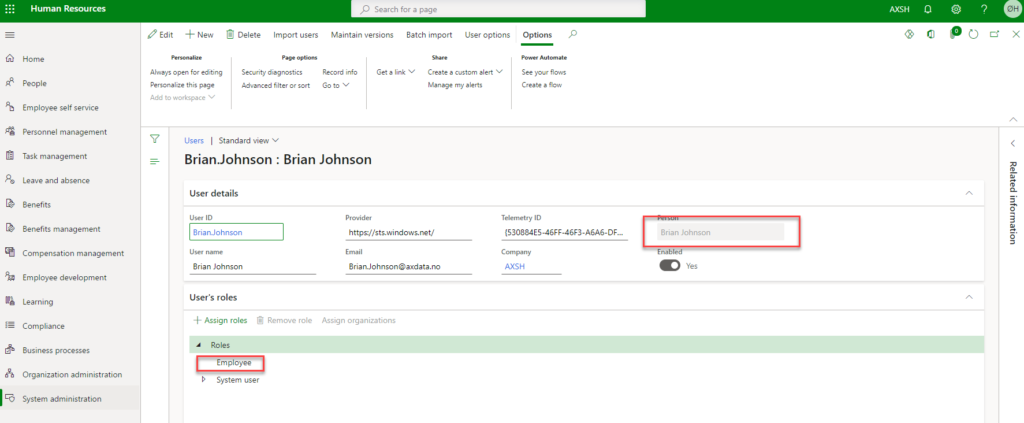
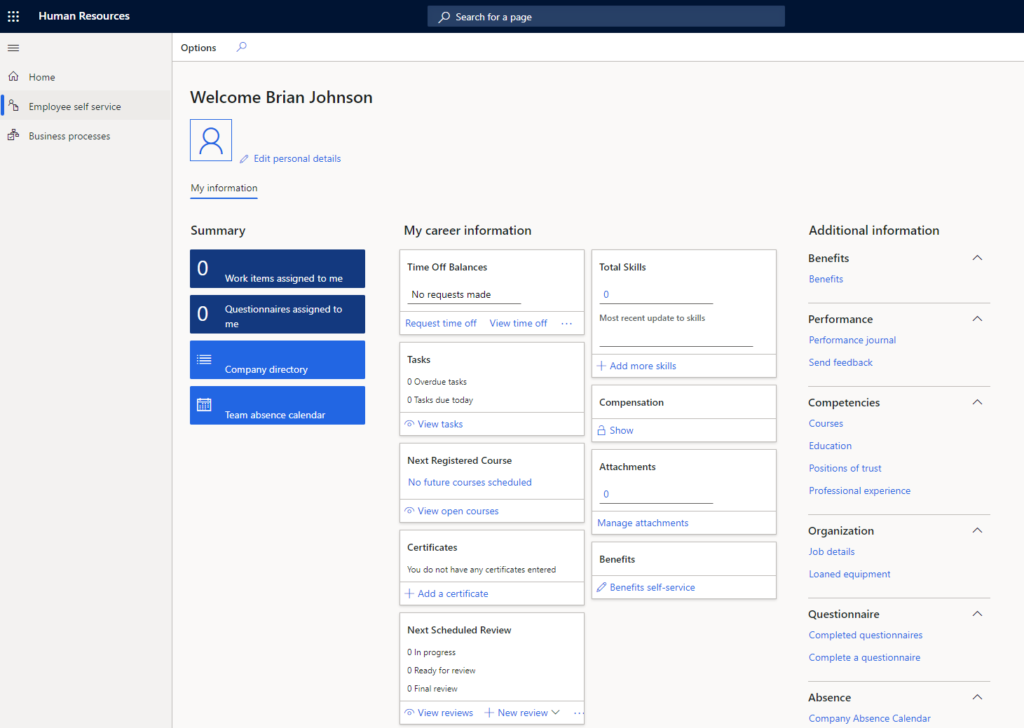
And, last, but absolutely not least, the night before the new employee has his firs day of work, a PowerAutomate runs and imports the user to Dynamics, connects the user to the correct employee in Dynamics, and assigns the security role Employee to the user so that the new employee has accsess to the Employee Self-Service workspace in Dynamics:
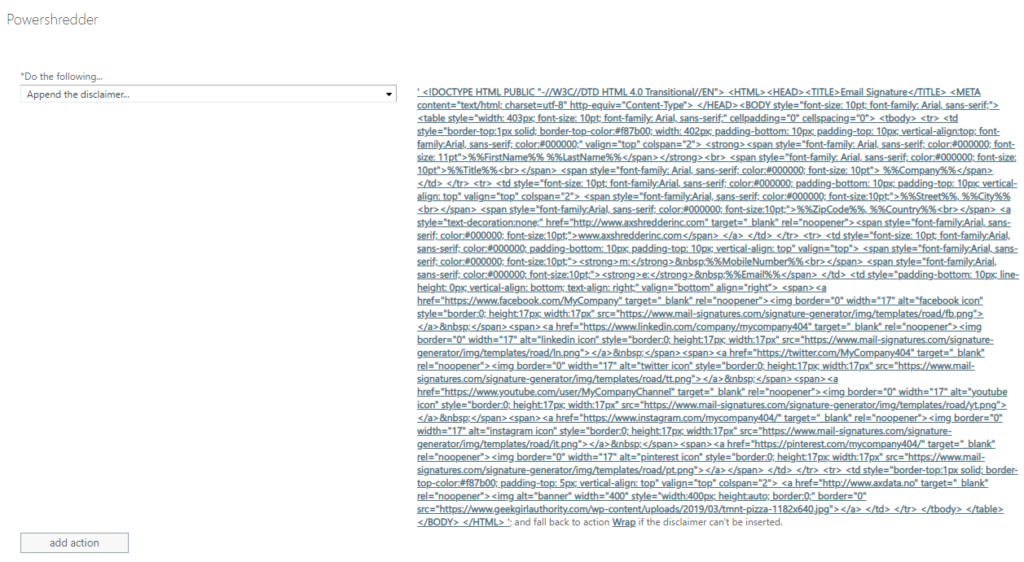
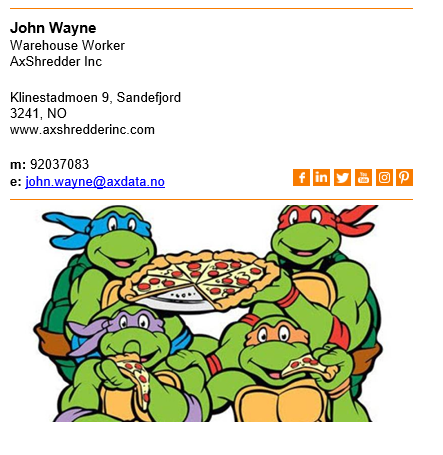
And, to end it all for now, we have automated the process for email signature, so that is is automatically put on every one of the emails you send out. Now they finally will lokk the same for the whole company:
The signature itself is created with HTML-code, after a rule is created in Exchange
After taken all the data from Dynamics into Synapse Middle-Aged Mutable Ninja Tuples wanted to be able to create views and use all data gathered in Synapse.
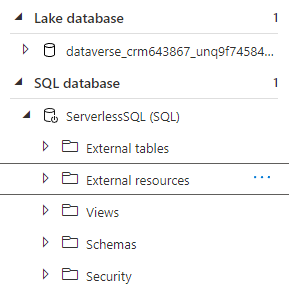
As a first step doing this we setup a serverless SQL.
This serverless SQL has no storage and only contain of the possibilities to g.ex create Stored Procedures and Views. This will able us to cross data from many sources and get a more rich way to doing analytics without duplicating data.
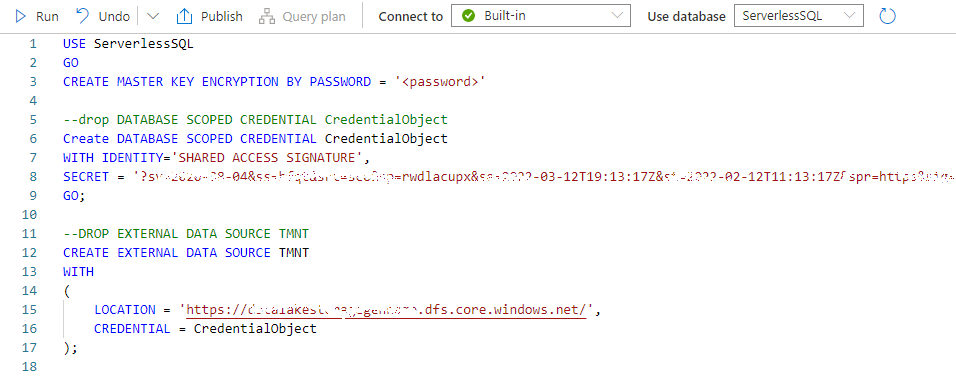
First thing first: Creating a External Data source for Serverless.
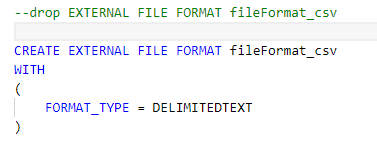
Then we need to create a fileformat
(This is not the final file format we ended up with – remember to update when working)
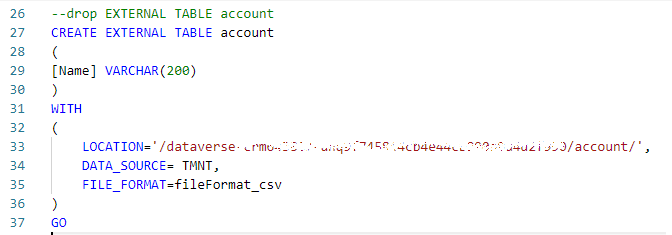
Next create all the external table(s) we need
!Note we only get the data we need from the CSV file, there are so many fields not needed in the source so let’s get those out of the way..
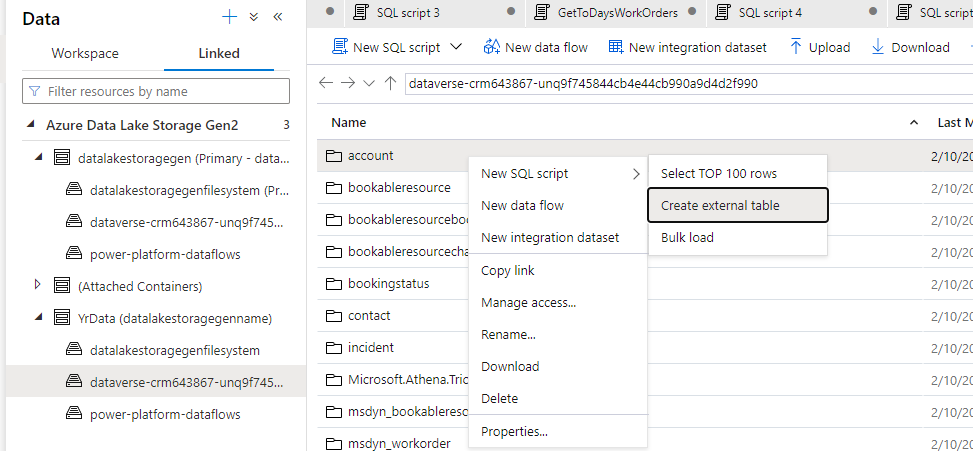
This would be the “code” way. But taking the time into consideration.. We used the GUI way:
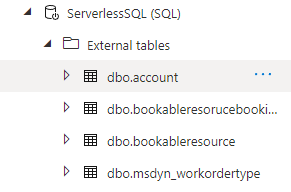
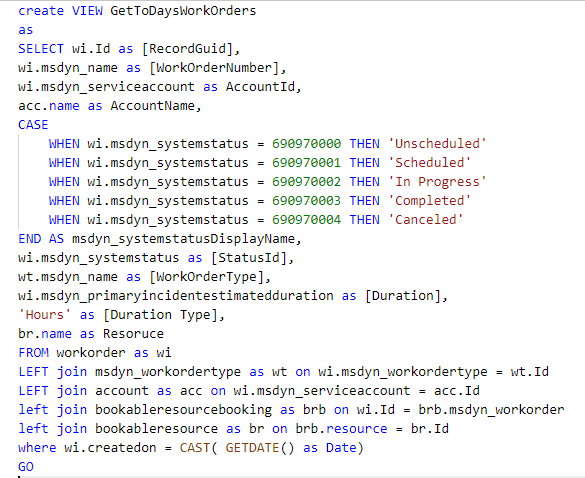
After creating all the external tables we can now create a view in serverless SQL using normal T-SQL
(Please don’t mind the “dirty case”. We tried to fix this in several ways. But could not find a solution)
Now we can use this View in Power BI to get Clean data from Synapse. We can even cross data from several sources without duplicating data.
Less work for those using Power BI, and more control of the data back-end. A win-win situation.
If this turtle had not been sick, he would dived further on, but as of to day, he has to go back to bed again..
Plans (if not sick)
Getting data from outside Dynamics
Weather info
Traffic info
Taken those data into Power BI.
Analyze of SOS alert VS weather and time used to solve SOS alert
Analyze of time used in traffic – optimalization of resource scheduling
++
Concerns: Synapse VS Data Export Service and it's deprecation After looking at the synapse and comparing it with the previous Data Export Service. (Deprecated) I look forward to the future. There are an incredible number of new possibilities for synapse versus Data export Service. However, there is one thing that worries me a little. How to translate Option set values to Display names in Synapse. This is a known issue from the past g.ex power BI. The data export service had a separate function that created an optionssetmetadata table where you could join together and get the different display names for each language on option sets values. As it is today, from the synapse you only get access to the option values and no longer have this support table to lean on. Ref: https://powerapps.microsoft.com/en-us/blog/do-more-with-data-from-data-export-service-to-azure-synapse-link-for-dataverse/