In the world of artificial intelligence, there are many ways to collect, analyze, and enrich data to create more personalized and meaningful experiences. One of the most innovative—and perhaps magical—methods of enriching data is through the power of voice. Eleven Labs, an AI company known for its advanced voice generation and natural language processing (NLP) technology, has found a way to turn data into something much more than just numbers and text: it gives data a voice.
In this blog post, we’ll explore how Eleven Labs—an advanced AI-driven platform known for its voice generation technology and natural language processing—can be used to enrich the data. Traditionally, sorting systems rely on questionnaires or predefined attributes to make these decisions. However, with the power of Eleven Labs, we transformed this process into something far more engaging and dynamic.
Eleven Labs helped us to enrich the experience by receiving and analyzing data that we send and enrich it by giving us back voice. This technology helped us make the sorting process more engaging and enjoyable. For example, using realistic voiceovers to narrate the sorting ceremony or create unique dialogues for each person being sorted.
When we give data a voice, we aren’t just providing users with information; we’re engaging them in a conversation, offering insights with nuance and tone, and creating an experience that feels more human. Eleven Labs leverages voice synthesis and speech recognition technology to bring data to life.
In the spirit of Hogwarts, where collaboration and resourcefulness reign supreme, we embarked on a quest to claim the coveted ‘Thieving Bastards’ badge. This badge celebrates the clever use of third-party solutions to enhance our magical creations. Just as the greatest wizards rely on ancient spells and enchanted artifacts, we too must harness the power of existing tools and APIs to weave our digital enchantments.
To bring our Hogwarts-inspired intranet to life, I delved into the vast realm of third-party APIs, selecting the most potent tools to aid students in their daily adventures.
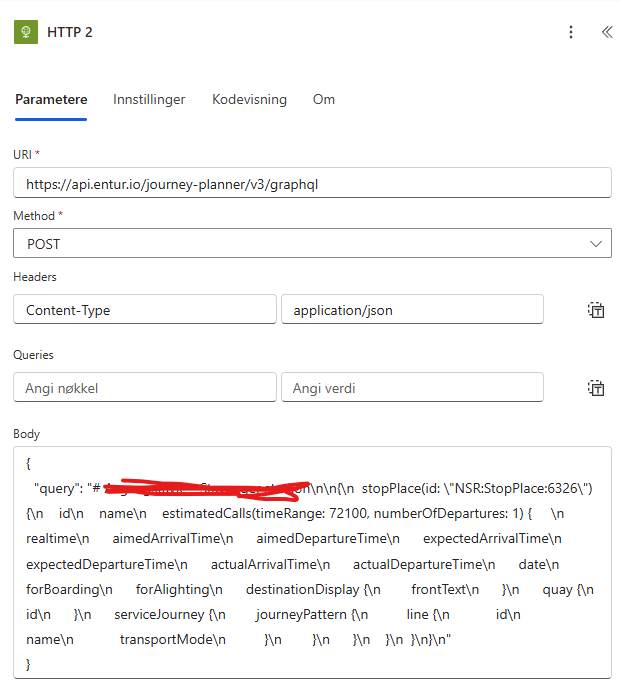
The Entur API: The Floo Network of Transportation Much like the Floo Network enables swift travel across the wizarding world, the Entur API provides real-time transportation data. By integrating this powerful API, students can easily plan their journeys to Diagon Alley with minimal hassle.
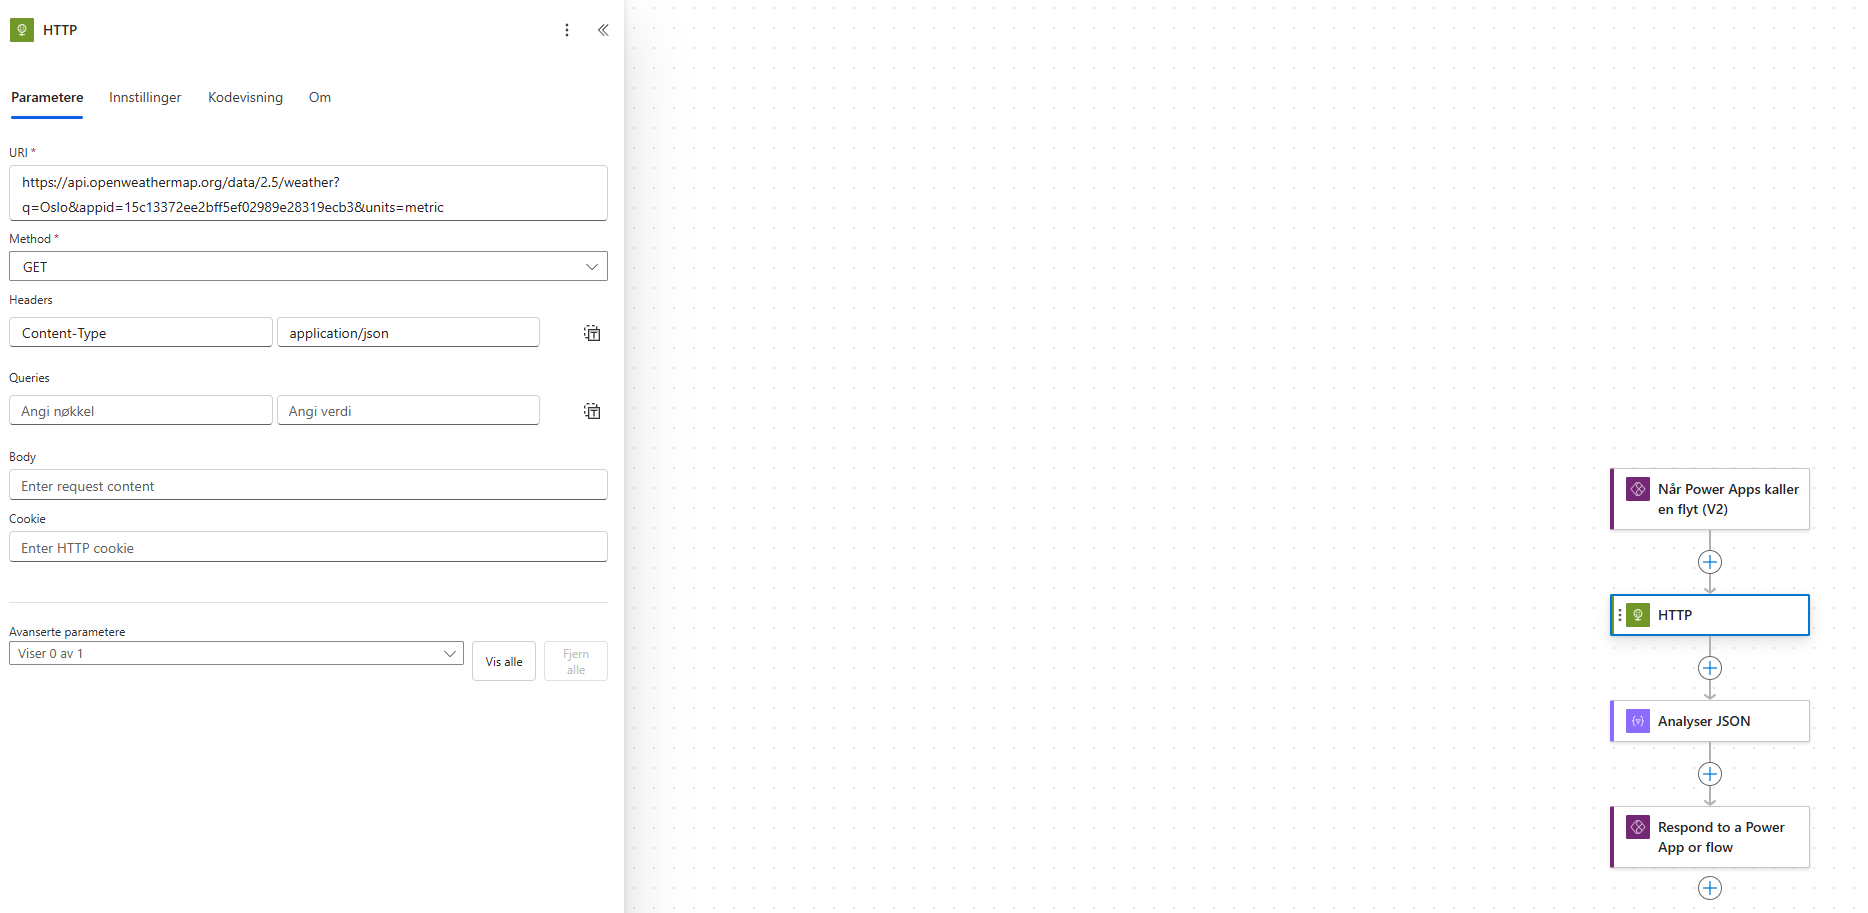
Weather API: The Divination Crystal Ball Professor Trelawney may have her crystal ball, but we prefer data-driven forecasting. With the weather API, students can prepare for their daily adventures, be it sunny strolls around the castle grounds or braving the rain on their way to Herbology class.
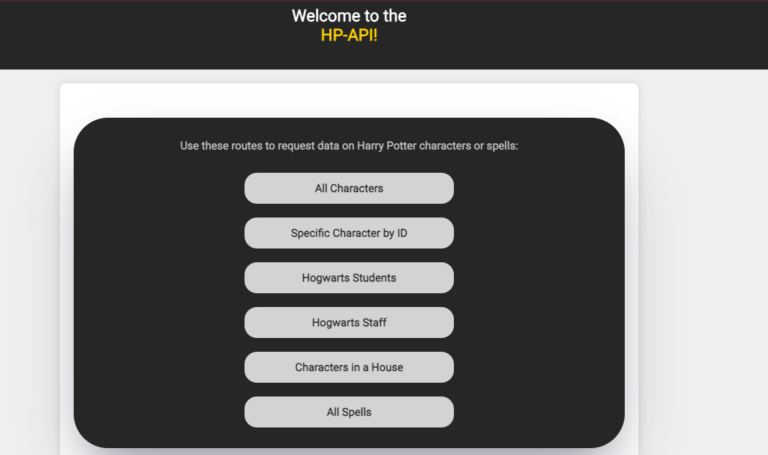
Harry Potter Database: The Restricted Section of Knowledge No Hogwarts intranet would be complete without a comprehensive spellbook. By utilizing a Harry Potter-themed database, students can look up spells, potion recipes, and magical creatures with ease, ensuring they are always equipped for any magical challenge.
OneFlow API Handling magical agreements and contracts has never been easier with the Oneflow API. Much like the enchanted scrolls used at Hogwarts, this API allows for the seamless management of digital contracts, ensuring that all agreements—from Hogsmeade permission slips to Quidditch team sign-ups—are securely handled and stored.
Mining for Gold: Claiming the ‘Dataminer’ Badge Beyond integrating third-party solutions, we have also used these APIs to extract valuable insights and present them in an engaging way. By combining transportation schedules, weather forecasts, and magical data, our intranet transforms raw information into actionable intelligence. Students can now see the best routes to Diagon Alley considering the weather conditions or discover spell recommendations based on current atmospheric factors. This fusion of external data with our own enriches the user experience and adds real business value to our solution.
We all know that Power BI is a beautiful tool for dashboarding, but it’s always a tricky question of where to get the data from. It needs to be fast, and most importantly, it should be correct.
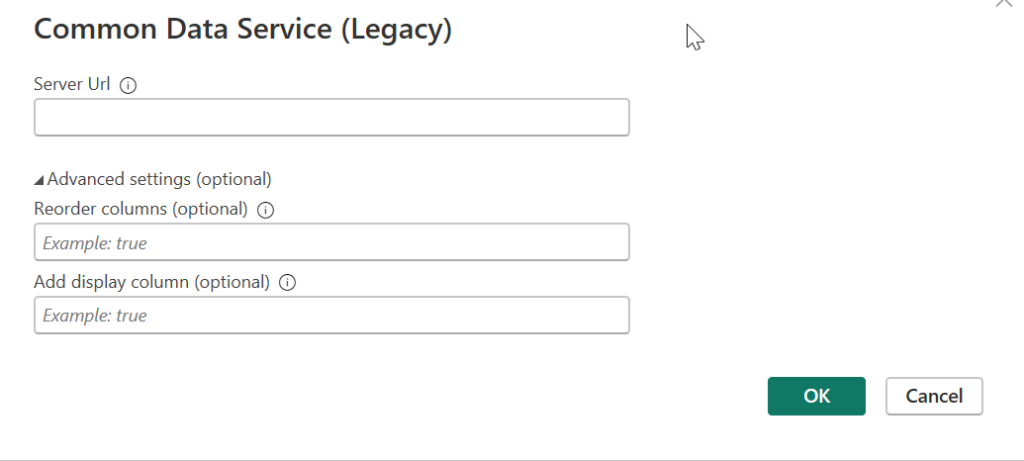
The traditional way, from what I gather, is using the CDS connector. Here, we get easily visible and editable tables.
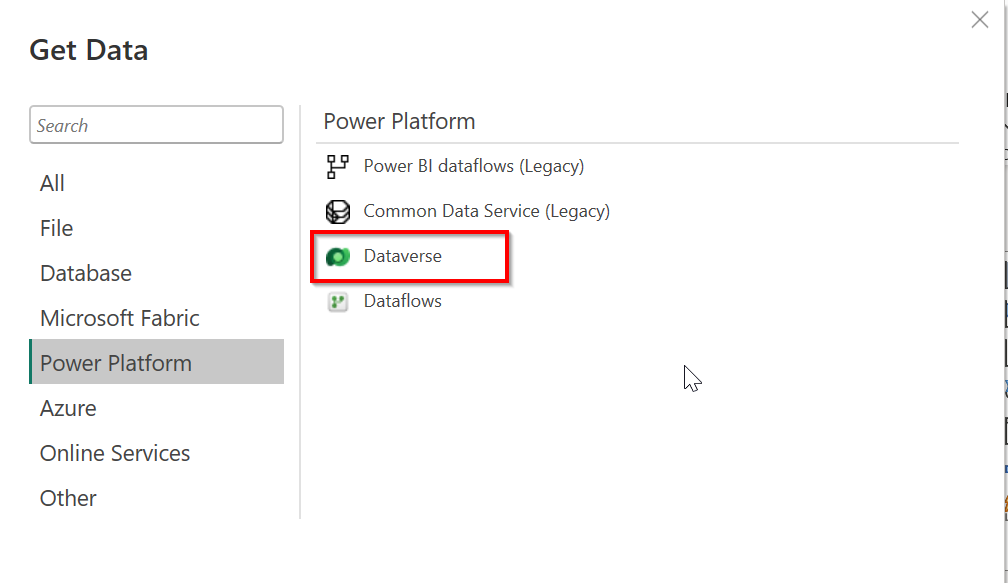
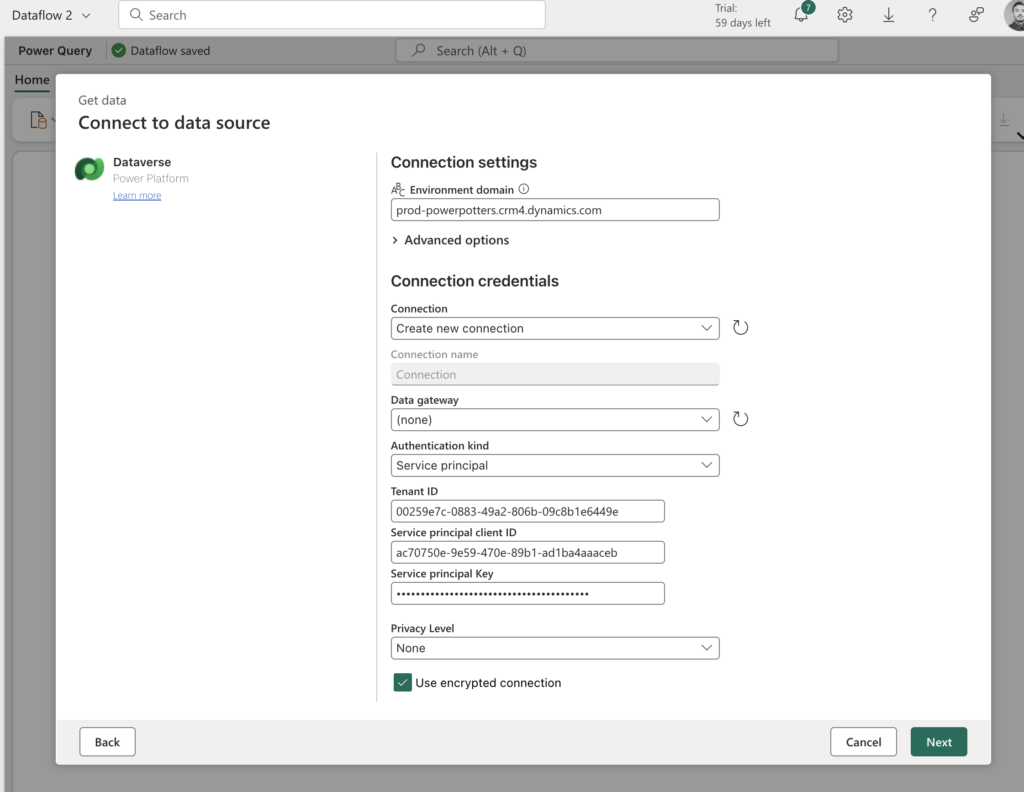
Another way, which will also give us Direct Query connection mode, is a connector directly to Dataverse.
But what about Fabric? If we need to create many reports on the same data from the CRM, then it would be perfect to have our data in OneLake, create DataFlow Gen 2 to transform it, and have a shared data model that will be utilized by different reports, dashboards, apps, etc.
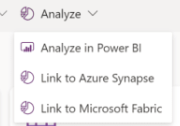
For that, there are several ways to do it. The most tempting one is just using a Fabric Premium subscription to create a Lakehouse and using Azure Synapse Link to sync the tables from PowerApps to Fabric.
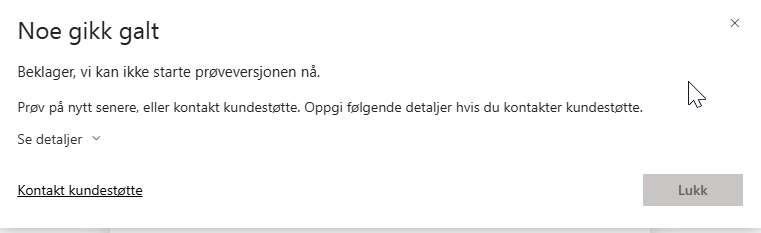
Unfortunately, when you have a Lab environment, it is not possible to create the OneLake on a Fabric workspace for now. Hopefully, this will be fixed in the future.
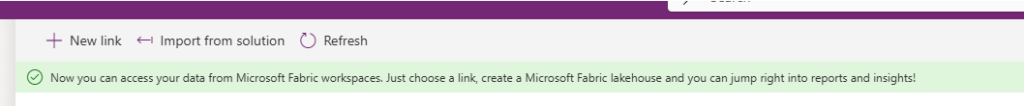
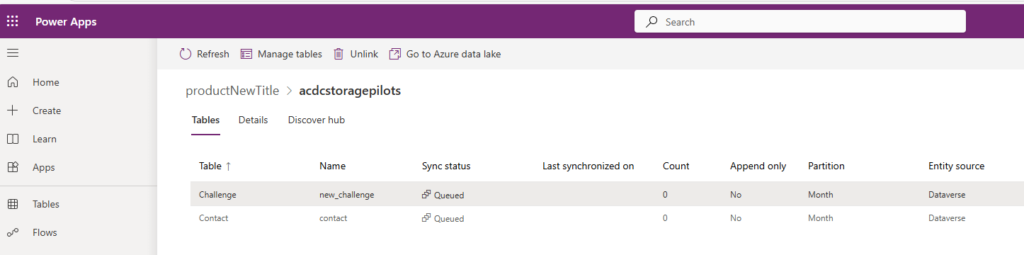
Another way is to create a resource group and create Azure storage account in the Azure Portal. If the user has the correct roles and access, then we should, in theory, be able to load tables from Power Apps to this storage and load them into a Storage Blob container. This approach got us much further, and we received a beautiful message on Power Apps.
However, when we try to create a link, the tables get queued but never appear in the Blob Storage.
However, for us, this approach did not work as our work tenant was registered in a different region from the Azure workspace where we are developing our CRM system.
Conclusion: If you are thinking of using Fabric, ensure your solution and Fabric are in the same region and don’t use the lab user.
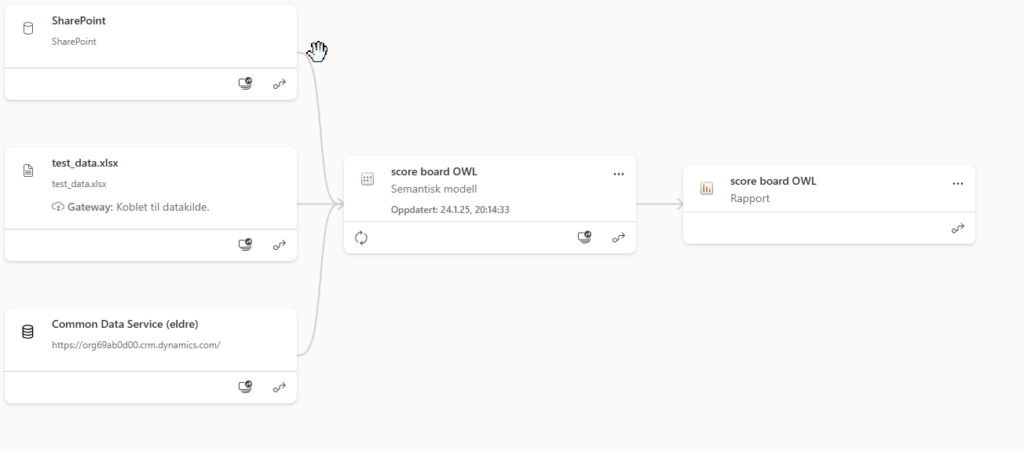
In the end, to have a beautiful, real-time updating report, we will go for the second approach described here: connecting directly to Dataverse and using Direct Query to have a real-time update of the changes.
We also used SharePoint to get images to visualize in the report, and Excel files (xlsx) for some test data.
🪄 Claiming the OneFlow Sponsor Badge – A Wizard’s Journey 🏅✨
Here’s a glimpse into how we 🧙♂️, have used OneFlow’s tools to conjure something truly extraordinary.
OneFlow – The Enchanted Contract Master 📜✨
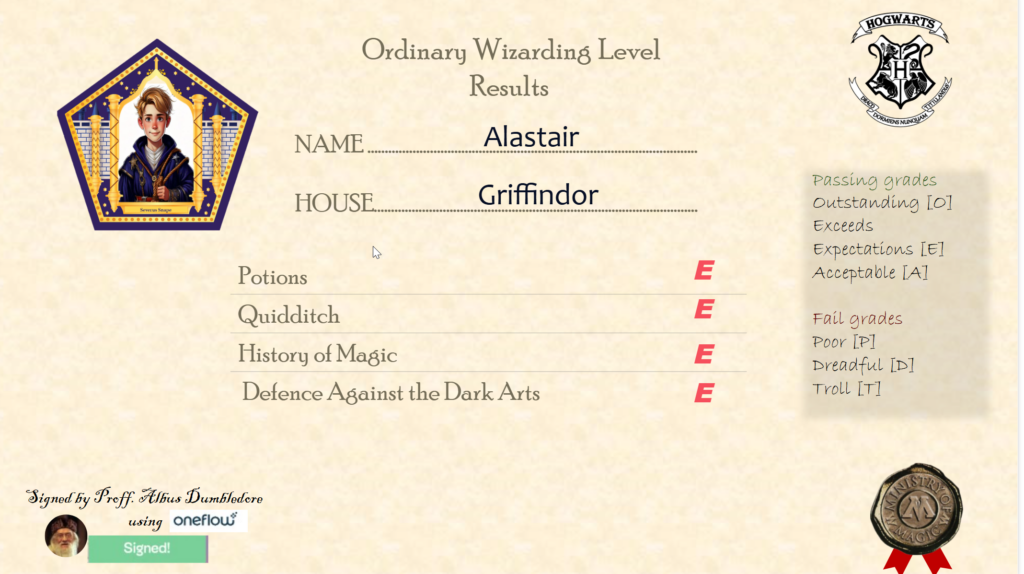
Welcome to the modern age of contract signing, where OneFlow transforms dull parchment into living, collaborative scrolls that can be signed seamlessly on any device. 🖋️ Whether you’re sealing a pact between Death Eaters or approving an Order of Doom, OneFlow ensures your contracts are as smooth as unicorn hair. 🦄✨
How We Cast the Spell
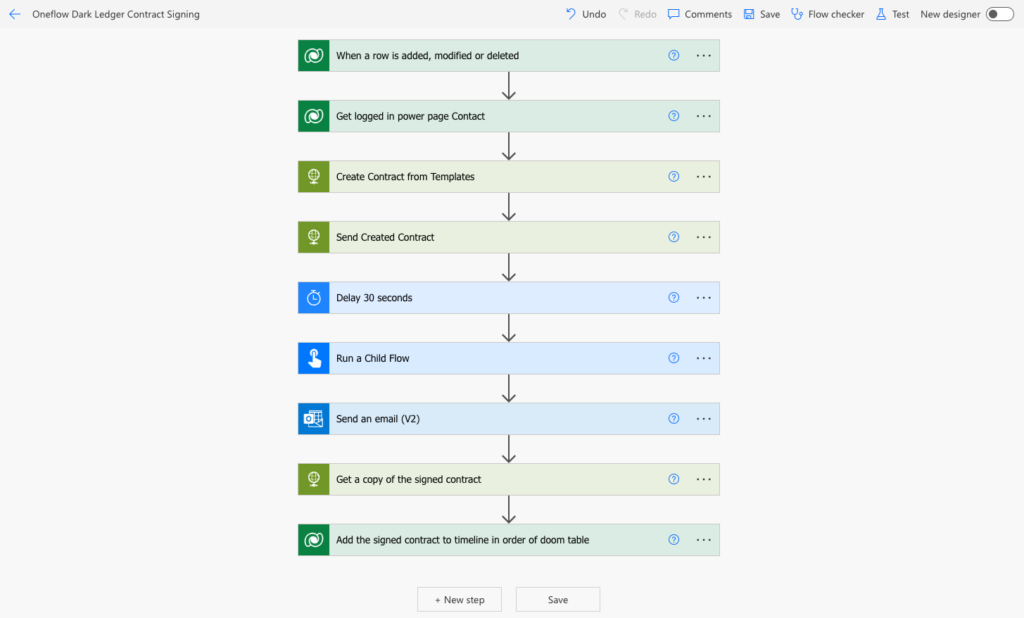
With OneFlow’s API, we created a spellbinding process to manage contracts for the sinister “Order of Doom.” Here’s how we conjured this masterpiece:
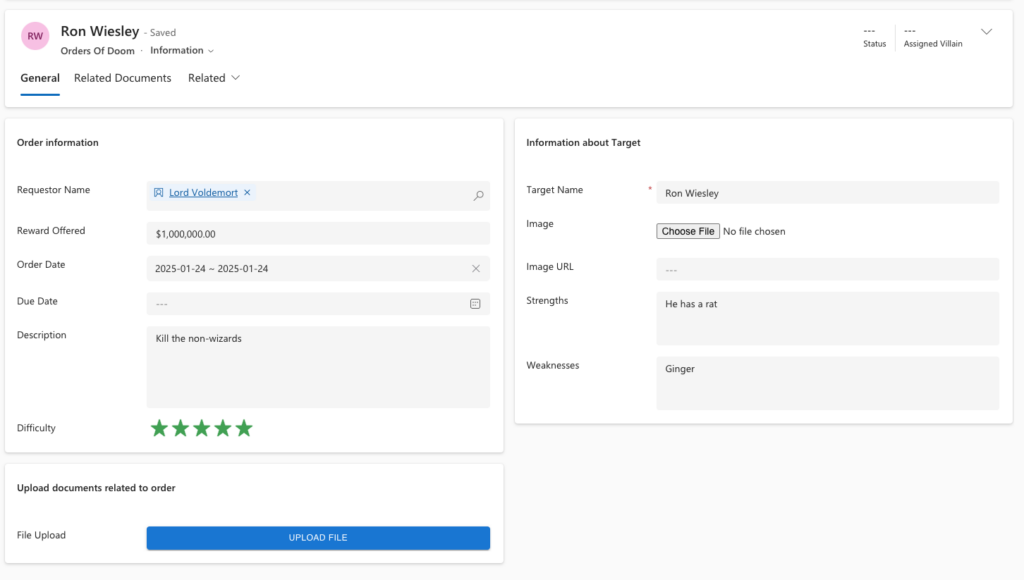
1. The Birth of an Order of Doom 💀🖋️
When a Power Page user (a dark wizard in disguise) creates a new Order of Doom in Dataverse, the spell is cast!
A cloud flow retrieves:
The wizard’s credentials (so we know who summoned the order 🧙).
The chilling details of their request.
2. Summoning the Contract 🔮📄
The cloud flow calls forth OneFlow’s API, using a mystical template pre-crafted in the OneFlow portal.
A contract is conjured between the Dark Ledger Party (us) and the requester (them).
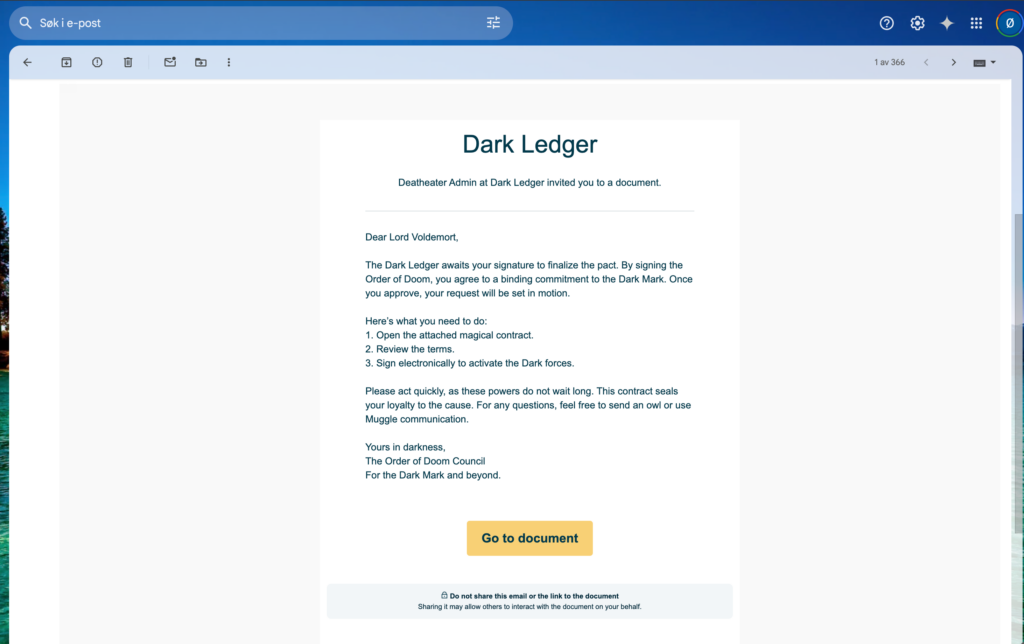
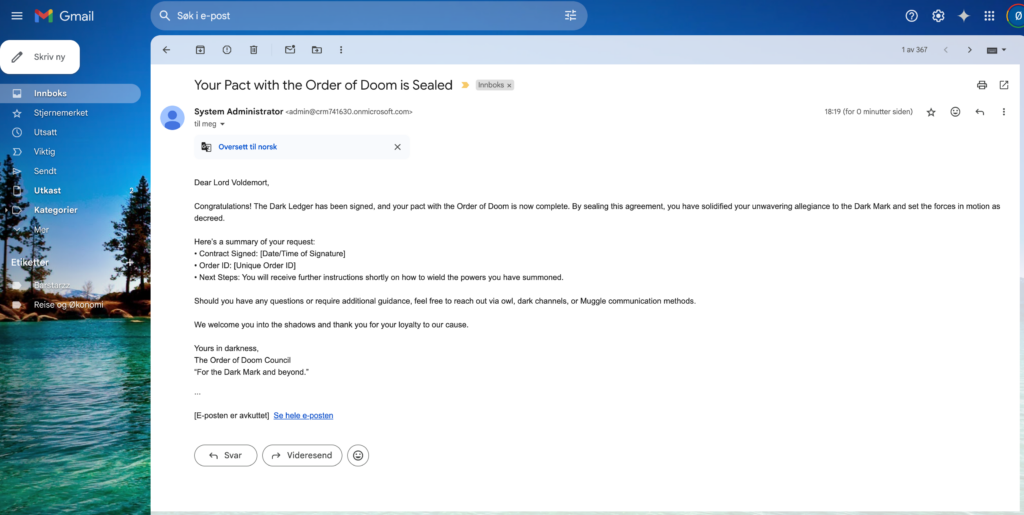
The enchanted scroll is sent via owl 🦉—or email (muggles might not appreciate owls)—for e-signature.
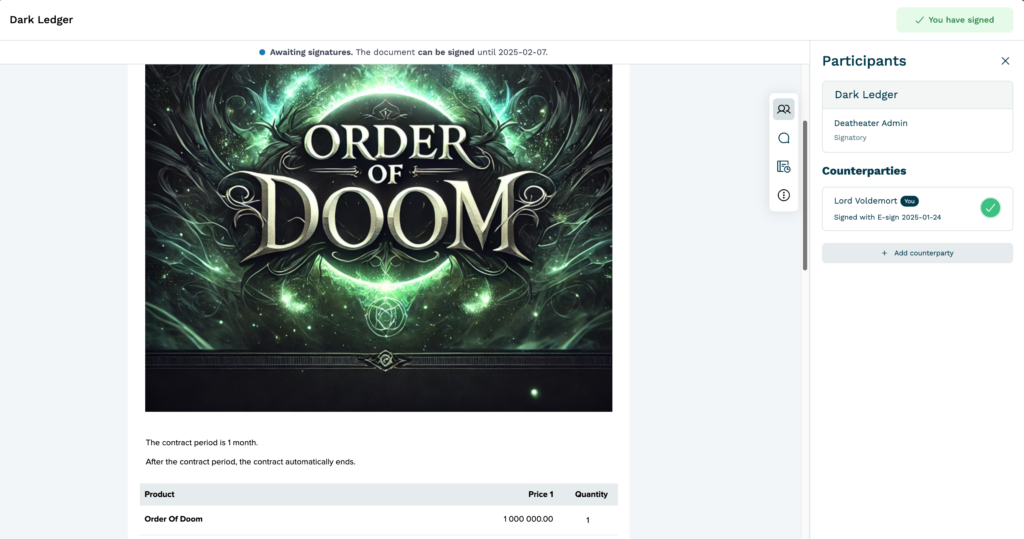
3. Signing and Sealing the Pact ✍️⚡
A child flow monitors the pact’s status like an Auror watching for dark magic.
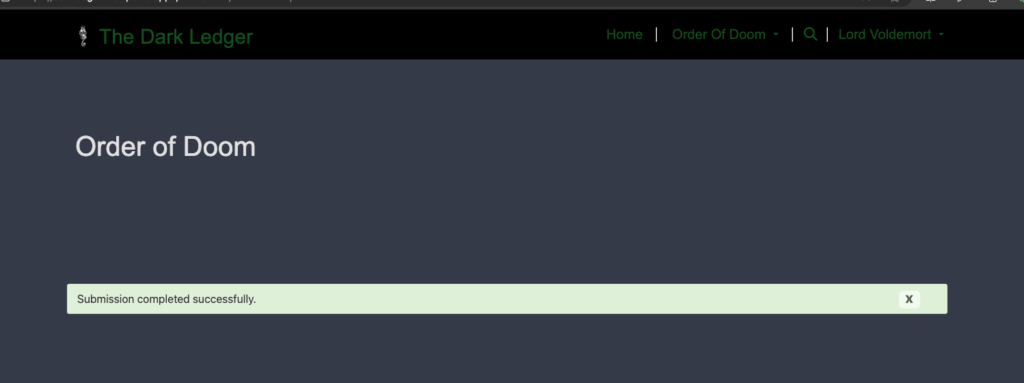
Once both parties have signed the contract, the spell completes:
An owl-email confirmation is sent to the requester. ✉️🦉
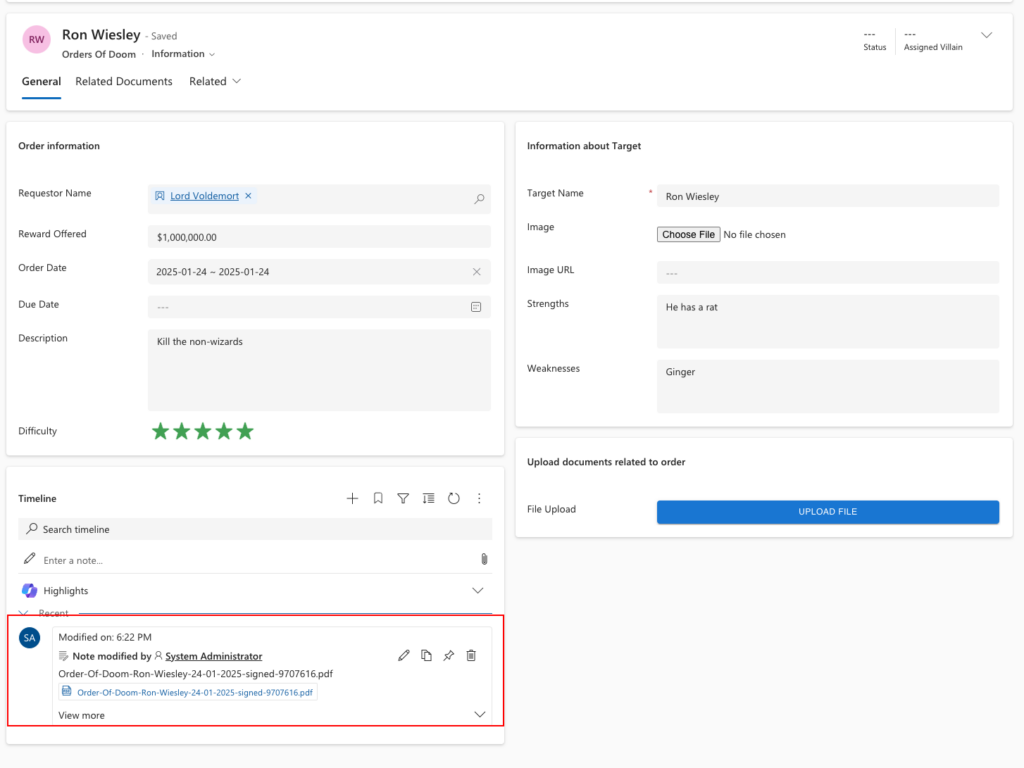
The signed scroll is attached to the timeline of the Order of Doom in Dataverse, ensuring it’s securely stored in the Ministry’s records (or our shadowy vaults).
Why This Wizardry Works
🧙♂️ Effortless Automation: The contract lifecycle is handled faster than a Hippogriff in flight.
🔮 Crystal-Clear Transparency: Both parties are guided through the signing process as if by the Marauder’s Map.
📜 Centralized Magic: Every contract is neatly stored, ready for future spells (or audits).
✨ Spellbinding Innovation: By fusing Power Platform and OneFlow API, we’ve created a process worthy of Dumbledore himself.
A first time for everything. I want to learn new spells and want to try fabric and power BI for the first time.
Testing import data to Power BI desktop – With both data import and Direct Query.
Setting the Data source credentials to get the queried data to the Power Bi Service.
Test is working – Now lets wave the wand and build!
Fabric
HACK:
Got help from a team in the same house – HUFFLEPUFF POWER.
We can not get the trial to work in our tenant that we have for ACDC, so i had to create a service principal user in the ACDC tenant – and make it available multitenant. And then use this service principal in fabric in my work tenant to get the data in there.
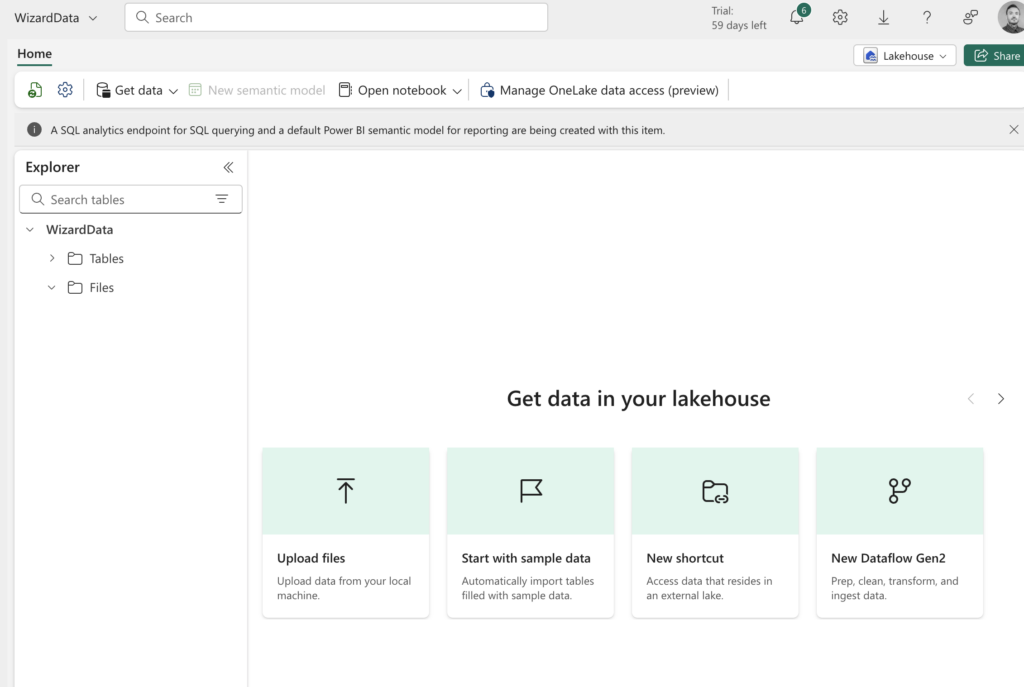
We want to make a lakehouse with fabric, so after the data is clean, we can use it in Power BI and also share the data with other instances that needs to use the data.
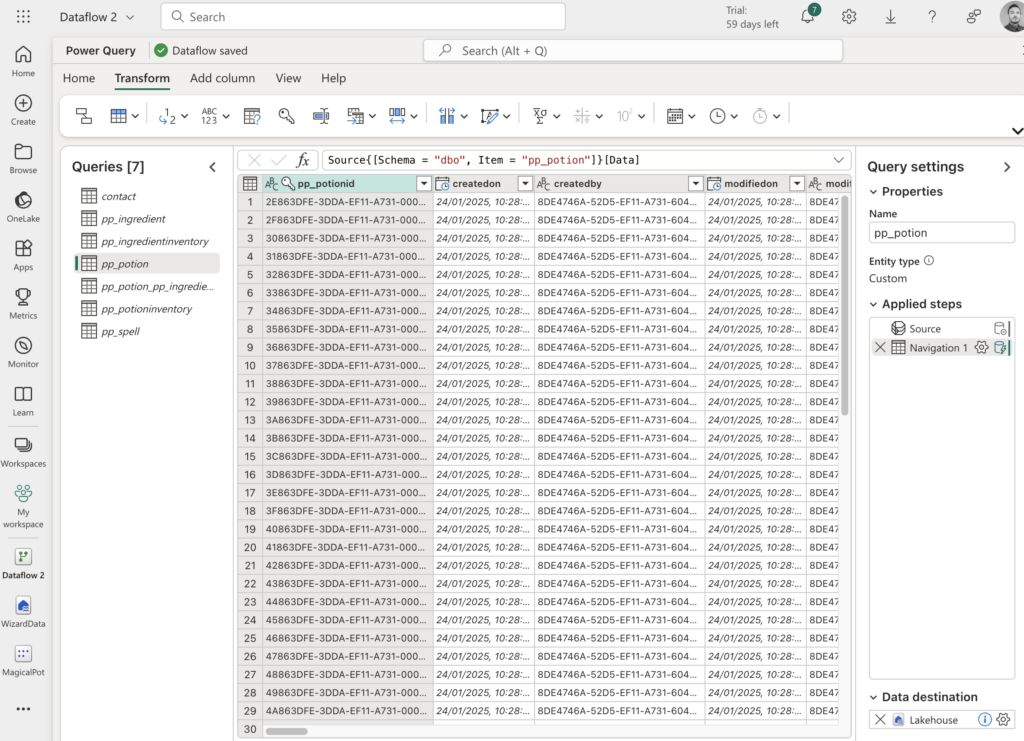
Made a new Lakehouse: WizardData
Made the connection to the ACDC tenant
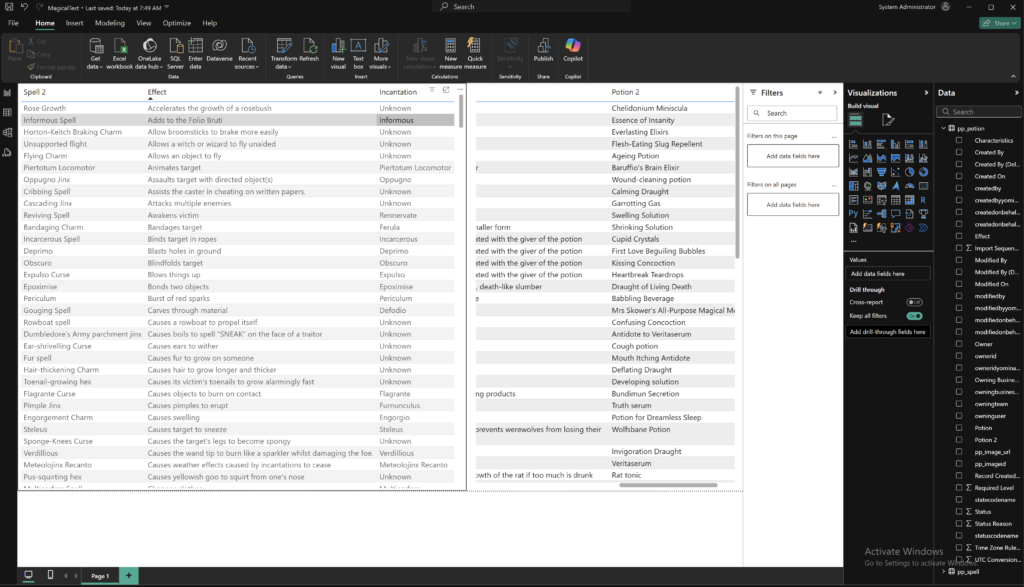
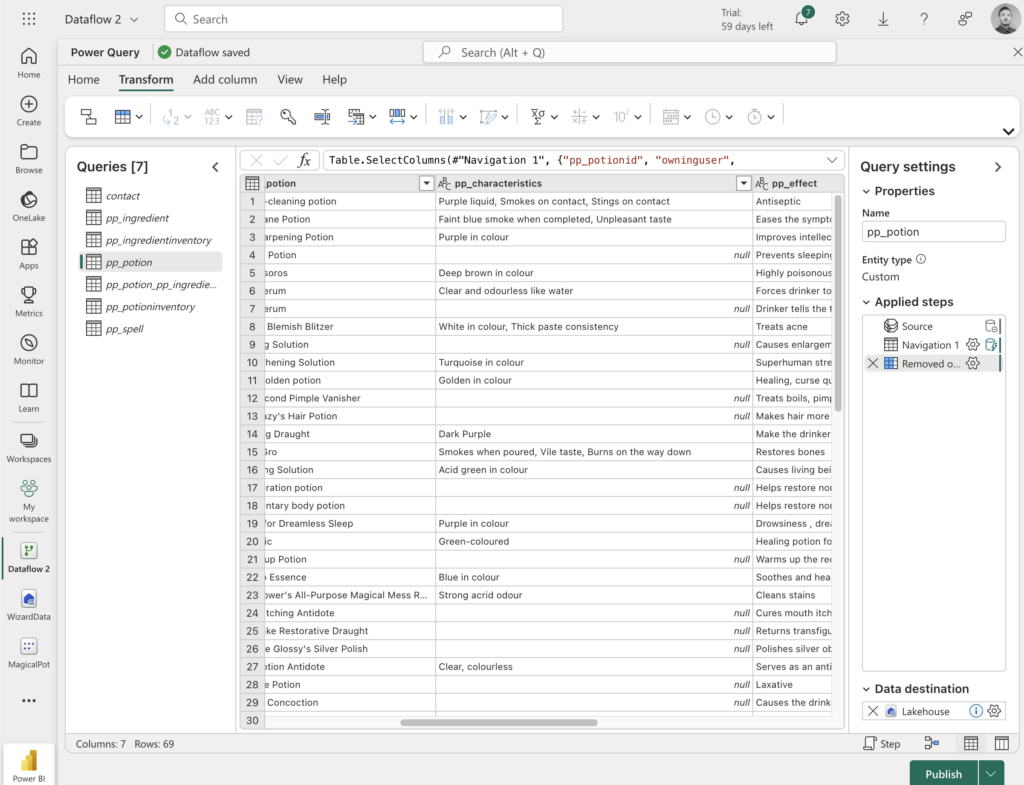
Cleaned the data:
Did this for all 7 tables.
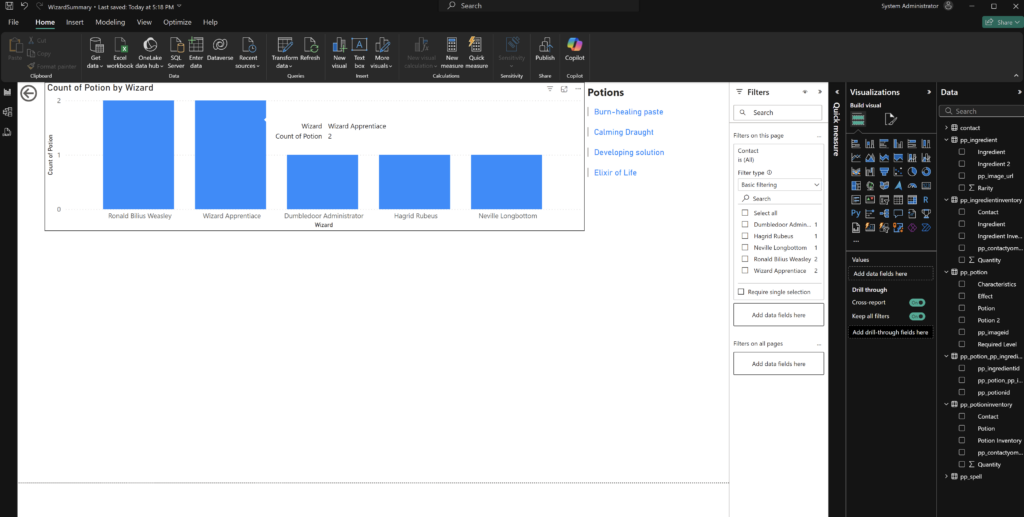
I could not get compliant with the Power BI for my work tenant. So i decided to use Power BI desktop direct query to get the data from Dataverse and build a dashboard.
Start of dashboard: To be continued.
One last comment – We helped another team with the HACK to get the ACDC data into another tenant. COMMUNITY! – SHARING IS CARING!
Recently updates including two more badges: Crawler and Dataminer.
Api, datasets and code are handy tools to share. But as a PowerBI rooky, it can just as difficult to get a overview and navigate through the magic Power BI provides. Thats why I wanted to share some insight into this area to make it easier for those who comes after us.
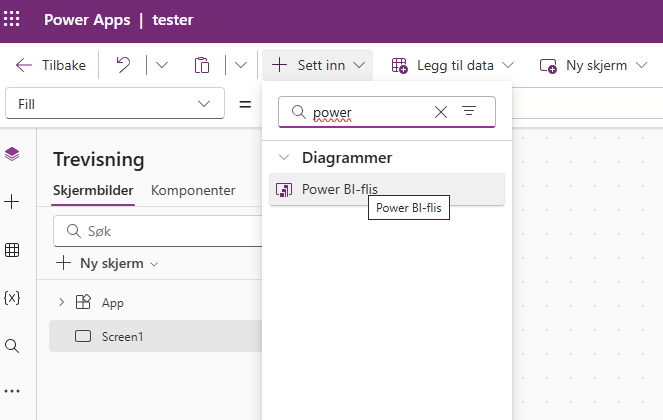
We have been struggeling for hours to find a way to embed the PowerBI report as an interactive report in the app. With a free trail not all features are possible, and some workarounds are needed.
After a whole lot of tries and fails as you can see below…
… we managed to put a PowerBI tile in the canvas app, with the wanted dimentions to match our apps design.
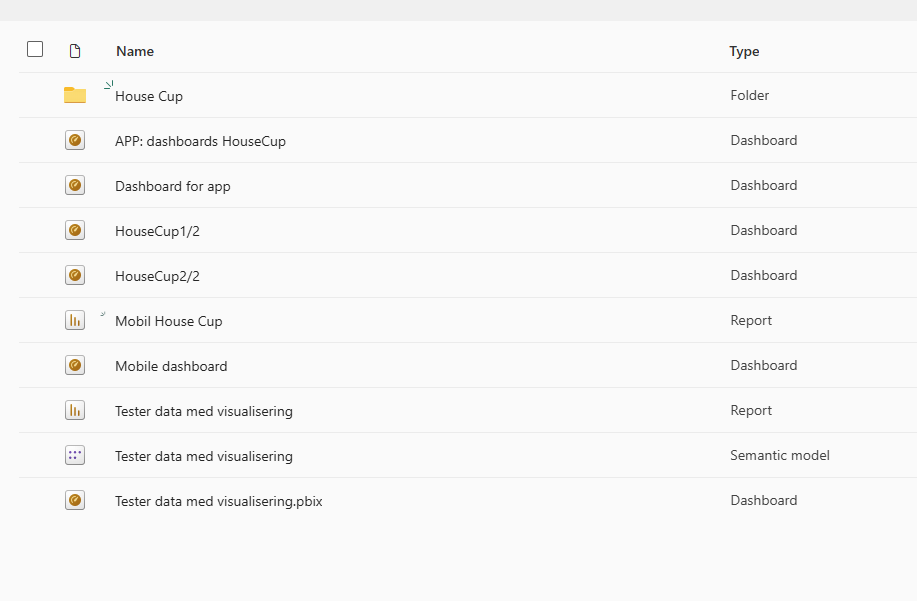
After publising your report to PowerBI service the same report can be saved as a tile in a dashboard. Having the whole report in one tile will make the vizualisations interactive with each other – which is more user-friendly.
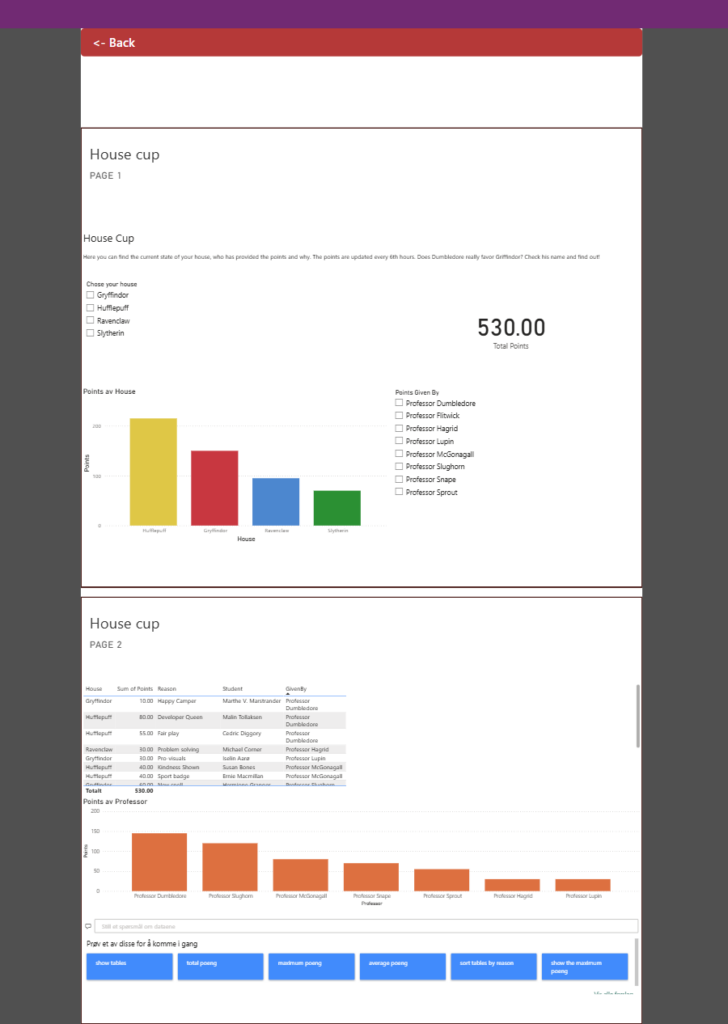
Embedding a Dashboard tile in the Canvas app was not the biggest issue – making it mobile friendly was a bigger problem. It was not possible to create a dashboard with a mobile display that could be embedded in the app. However, splitting one Raport into 2 Dashboard tiles seemed to be the best way to get the wanted result (visually), even though it was not as interactive as we wanted. But its good enough – as shown below.
Getting the data
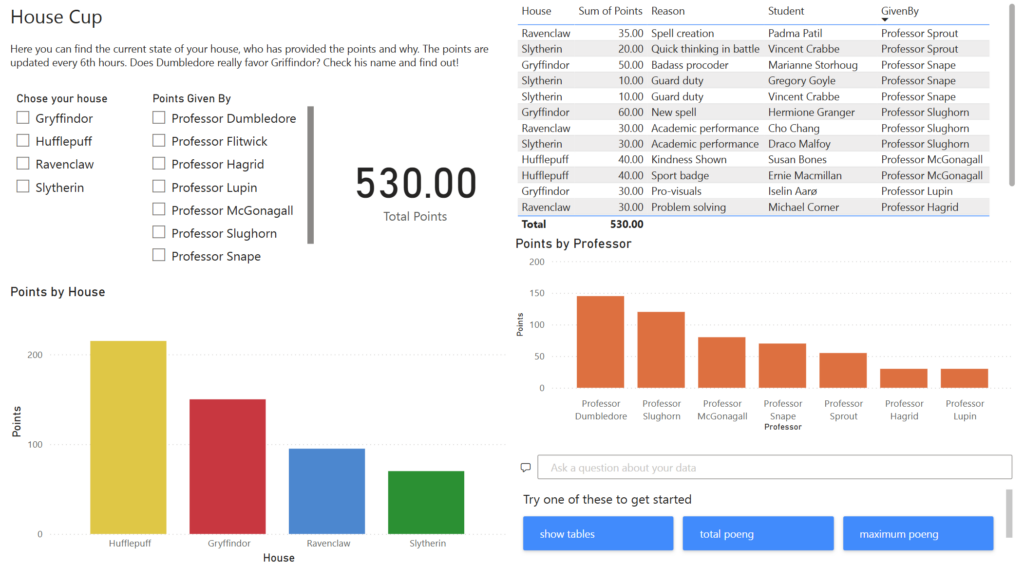
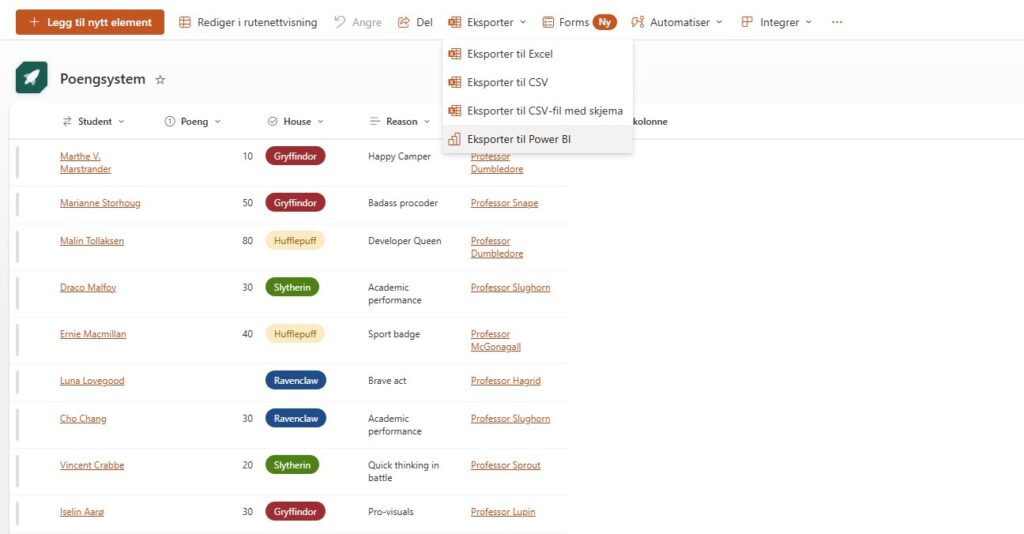
Dataminer: We created our own data in SharePoint lists showing the House Cup Points, combined with the other lists. This created the base for exporting this data directly into PowerBI
SharePoint as datasource
Lists: Students, PointSystem, Houses, Professors
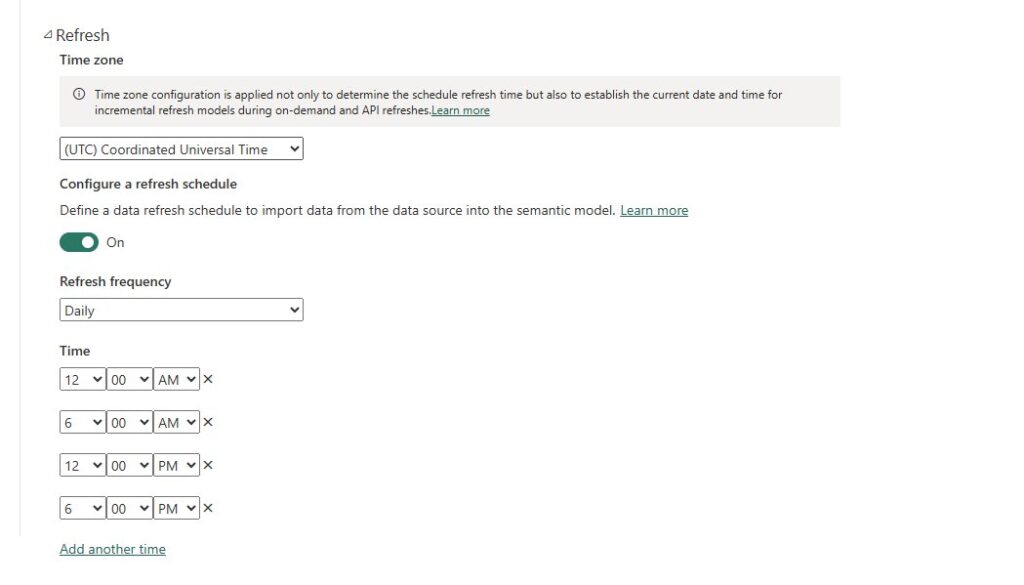
In the semantic model we configuredSchedueled refresh (every 6th hour), ensuring that the data updates often enough so the students can keep track of their progress.
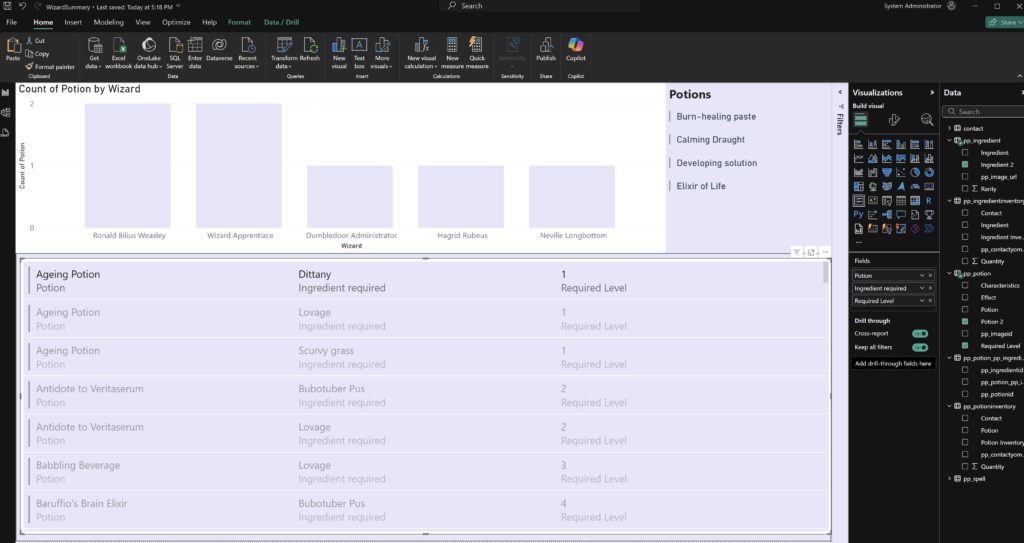
The semantic model provided enough data to create the golden report we later embedded in the app.
Crawler: Search and AI in PowerBI report
In PowerBI we included this cool visual where the data is searchable simply by using natural language to ask what the data contains. This is a flexible way for users to access data even though it is not in any of the visuals.
Let us demonstrate:
Helping out
Walking down the hallway – I bumped into Sopranova struggelig with the same thing I just figured out how to do. Lending a hand and providing some guidance we managed to create a custom page with a embedded dashboard tile for their app.
We were very happy about that.
So if anyone else needs a hand in this spesific area we are happy to help:)
Greetings, fellow wizards, witches, and tech enchanters! As proud members of House Slytherin, we at Team PowerPotters are no strangers to thinking big, acting boldly, and weaving a little magic into everything we do. This time, we’re thrilled to present our solution—a perfect blend of resourcefulness, ambition, and innovation—that makes a strong case for not one, not two, but three badges: Hogwarts Enchantment, Dataminer, and Stairway to Heaven.
Here’s how we’ve brought our cunning vision to life, blending the wizarding world with business processes and cutting-edge technology.
🪄 Hogwarts Enchantment: Magic in Every Workflow
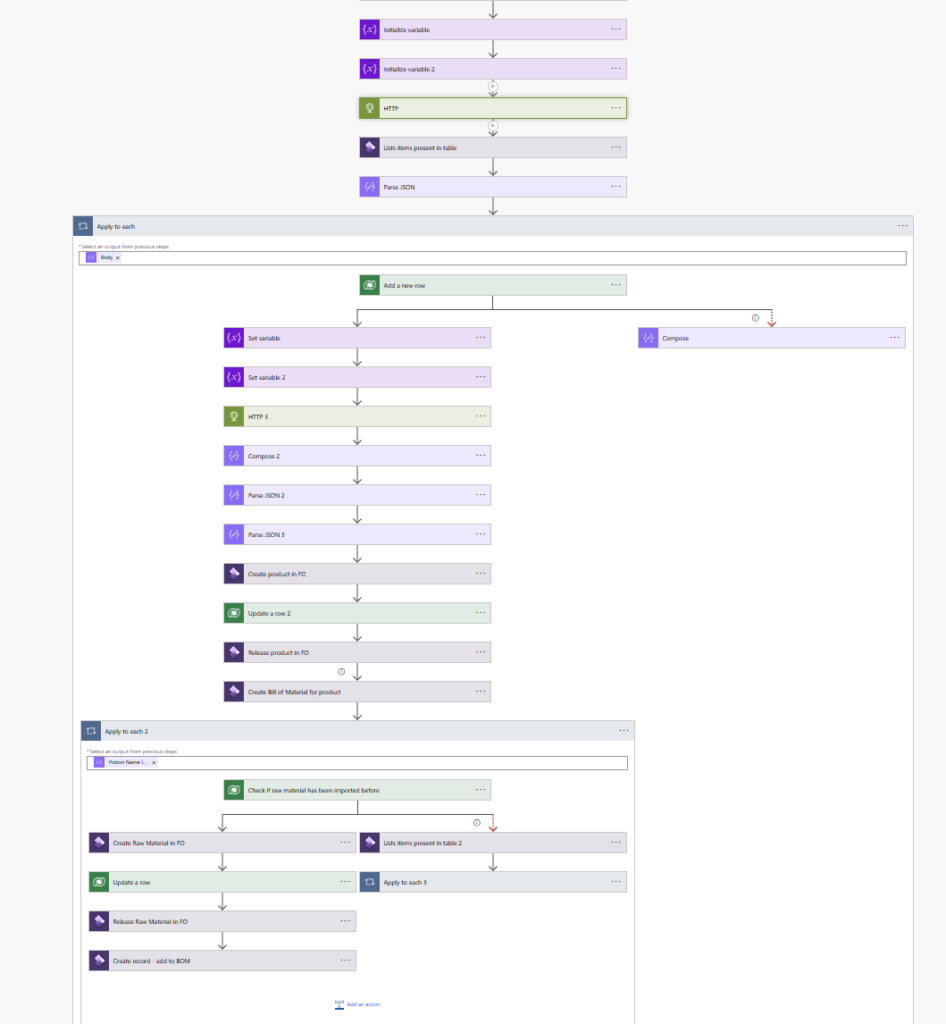
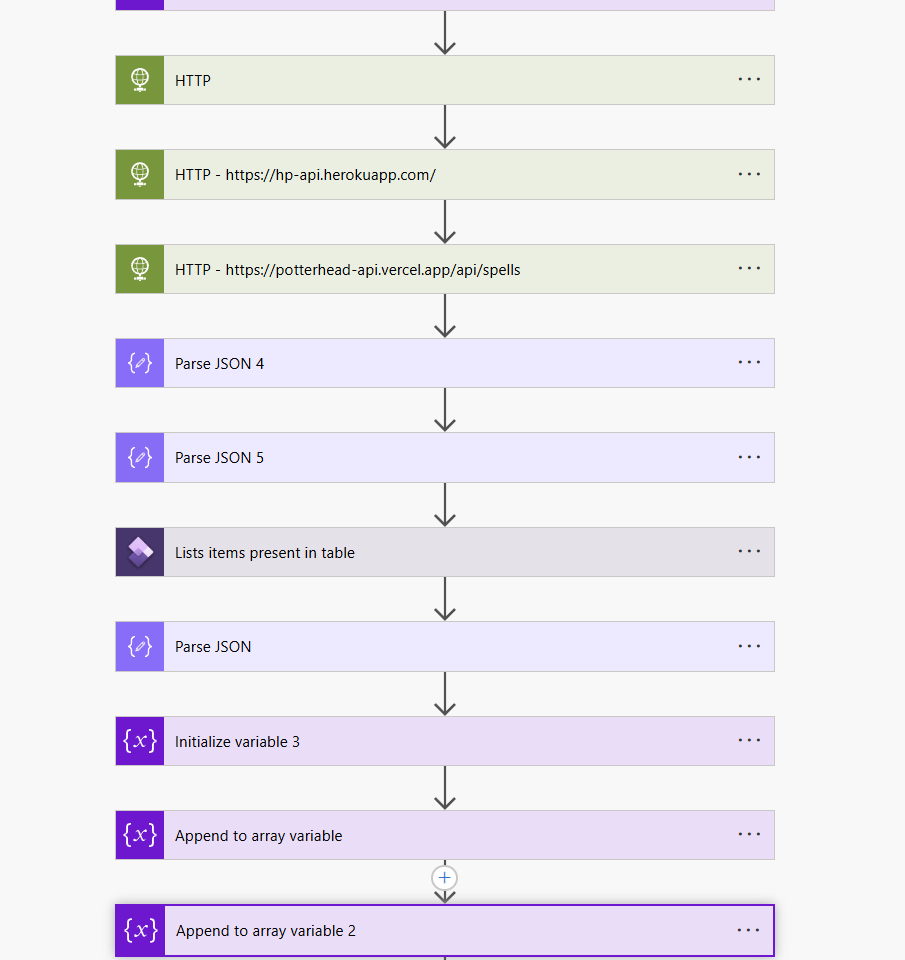
They say Slytherins know how to blend strategy with creativity, and our solution proves it. By integrating external Harry Potter APIs, enriched with AI magic, we’ve transformed ordinary data workflows into something straight out of the wizarding world:
Magical Data Sources: Using three Harry Potter APIs, we dynamically fetch spell-related data.
AI-Powered Enrichment: OpenAI serves as the magical mind, enriching spell data with unique descriptions, insightful classifications, and relevant connections.
For example, a spell fetched from the API is expanded with product details and seamlessly integrated into Finance and Operations (FO).
Invisible Charms at Play: A clever “dirty hack” with Dataverse acts like an invisible charm to detect duplicates, ensuring a seamless user experience and efficiency.
✨ Why This Deserves the Badge: By blending AI, external APIs, and intuitive workflows, we’ve brought the enchantment of Hogwarts to life within business processes. It’s not just automation—it’s pure magic.
🐍 Stairway to Heaven: Ambition Meets Integration
As true Slytherins, we always aim for the top. With this solution, we’ve ascended the metaphorical stairway to technical greatness by integrating three major Microsoft services into one seamless, end-to-end workflow:
Dataverse: Acting as a logical trap, it checks for duplicates using error-driven logic, saving time and resources.
Finance and Operations (FO): The heart of our solution, FO handles enriched product creation, BOMs (Bill of Materials), and inventory management.
OpenAI: Enhances data with contextual business insights, transforming raw API information into actionable intelligence.
✨ Seamless Integration in Action:
Data flows from the Harry Potter APIs to Dataverse, where duplicate checks occur.
OpenAI adds contextual magic before FO processes the enriched records, ensuring they deliver maximum business value.
✨ Why This Deserves the Badge: The solution builds a stairway that bridges data, AI, and business processes. It’s efficient, scalable, and a testament to the power of intelligent integration.
🧙♂️ Dataminer: Uncovering Magical Insights
Our solution didn’t just extract data—it transformed it into gold worthy of a Slytherin treasure vault:
Using Harry Potter APIs, we mined spell-related data and applied AI to add context, relevance, and business-ready value.
We didn’t stop at fetching data. We turned it into actionable insights that integrate seamlessly into business systems, eliminating manual work and reducing errors.
✨ Why This Deserves the Badge: This isn’t mere data extraction—it’s intelligent, enriched, and purposeful mining that creates real value.
🪄 Why We Deserve All Three Badges
Our solution is a shining example of Slytherin ingenuity, ambition, and teamwork. It seamlessly meets the criteria for:
Hogwarts Enchantment: By combining APIs, AI, and intuitive workflows, we’ve made business processes feel truly magical.
Stairway to Heaven: Through integration of Dataverse, FO, and OpenAI, we’ve built a harmonious system that transforms data into value.
Dataminer: We didn’t just gather data; we mined and enriched it with AI to deliver insights that matter.
🔮 A Slytherin’s Call to Action
House Slytherin has always been about turning ambition into achievement, and this solution is no exception. With our resourceful approach to combining APIs, AI, and business logic, we’ve created a system that not only solves problems but does so with a touch of magic.
We humbly present our work for consideration for the Hogwarts Enchantment, Stairway to Heaven, and Dataminer badges. Ambition, strategy, and ingenuity—it’s the Slytherin way.
(c) Faruk The Fabricator inspired by the Silicon Valley series.
If you think a student’s story begins when they enroll at Hogwarts, you could not be more wrong. The Fabricator is evil and does not care about privacy. The Fabricator is guileful and does not care about truth. He will do everything in his power to gather or fabricate every detail of their lives and use it to achieve his goals.
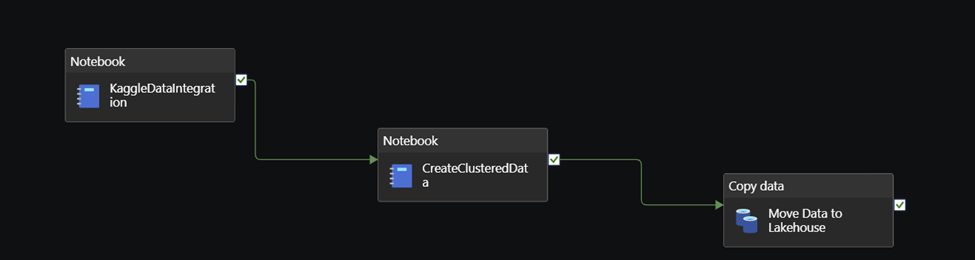
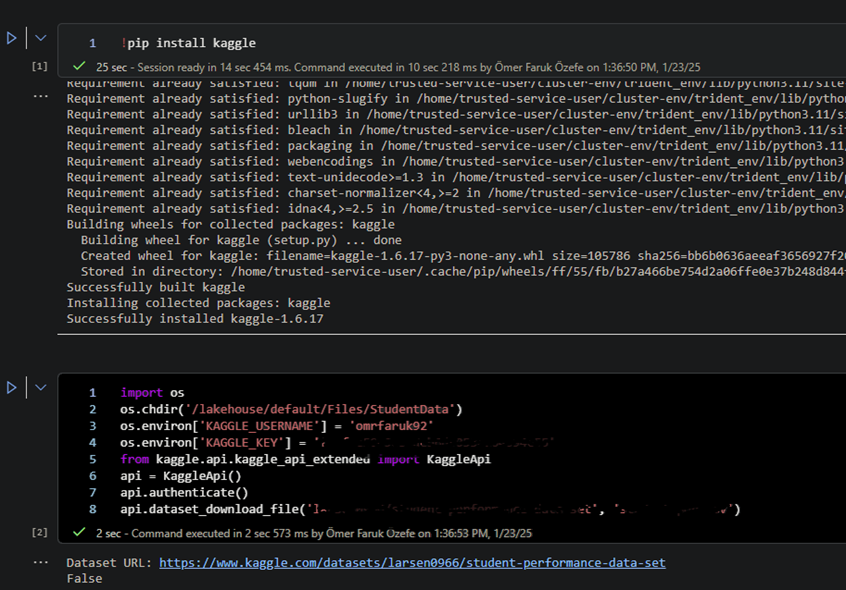
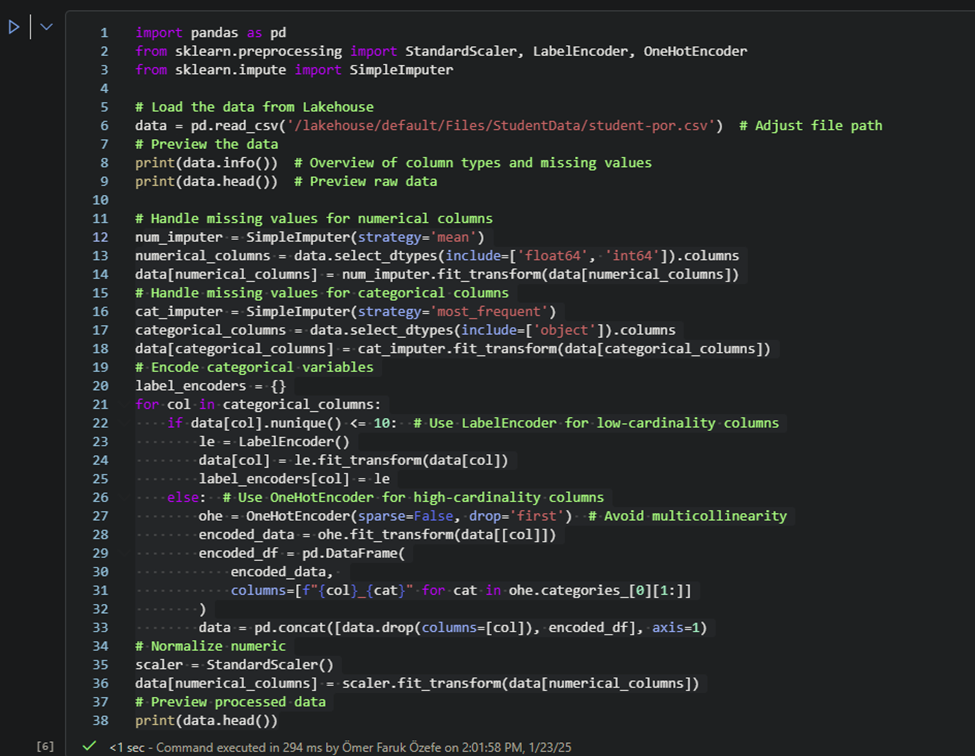
At the moment, The Fabricator uses Fabric to access previous data of the students wishing to enroll at Hogwarts. We call the Kaggle API within notebook code to retrieve data from Kaggle and write it as a CSV file.
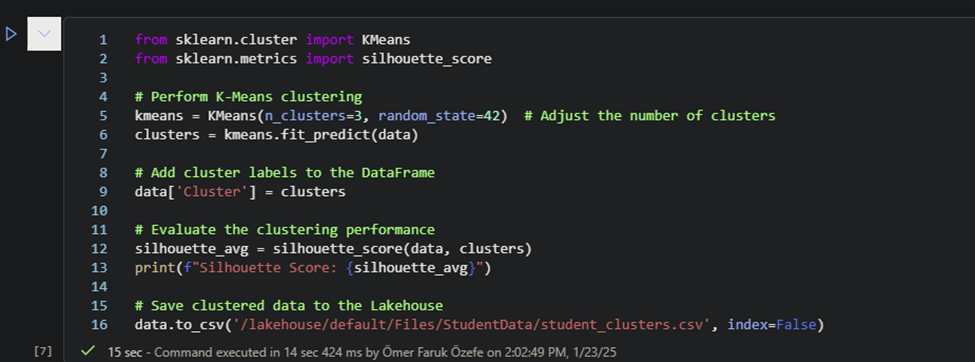
Python code in another notebook is then used to transform this data and divide it into clusters.
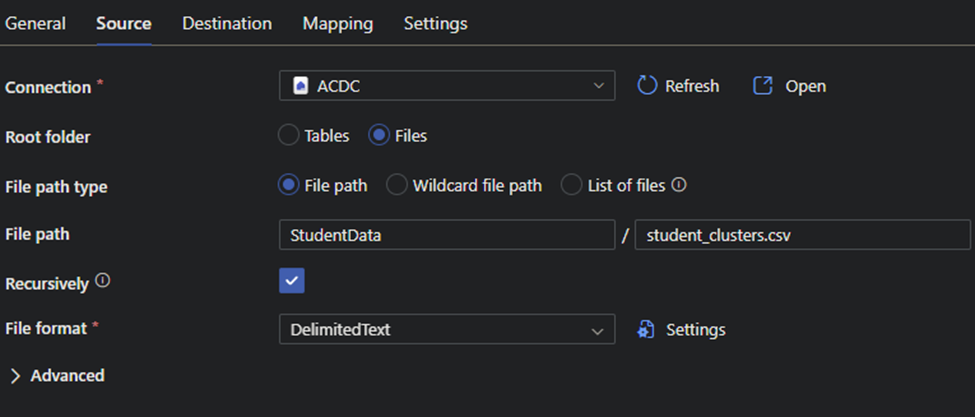
Finally, a “Copy Data” activity moves the data to its final destination. But is this truly the end?
Follow the Fabricator for more—if you can, that is.
In the coming days, the Fabricator plans to:
Show clustered data in Power BI reports.
Use insights to plan interventions or recommendations for students.
Perform behavioral predictions: Use the clusters as labels for supervised learning models to predict future performance.
Trigger emails or alerts for specific clusters needing attention.
Data is born into Fabric, molded by it. Data does not see the light until it is ready to face users. And when it is finally presented, it is blinding.
(c) The Fabricator and The Batman.
PS: with this article we claim the following badges:
Thieving Bastards – we use online data source from kaggle
Dataminer – we are doing data transformation for better reporting and we are using extrernal data.
Go With The Flow – we create the pipeline that can be used to retrive any data from kaggle. We plan to use data activators to send alerts based on the processed data.
Power User Love – in fabric we created pipeline as a low code solution. inside pipeline we are using python code for advanced operations.
Nasty Hacker – for retrieving data from 3rd party services and syncing it to the blob storage to connect to Azure AI Studio
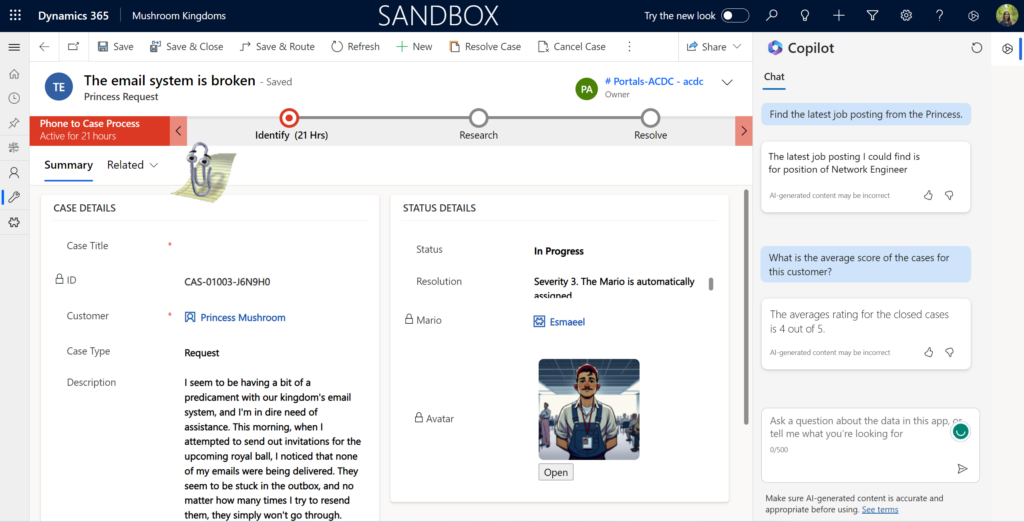
Data miner – for retrieving the case information from dataverse and calculating the average score using AI.
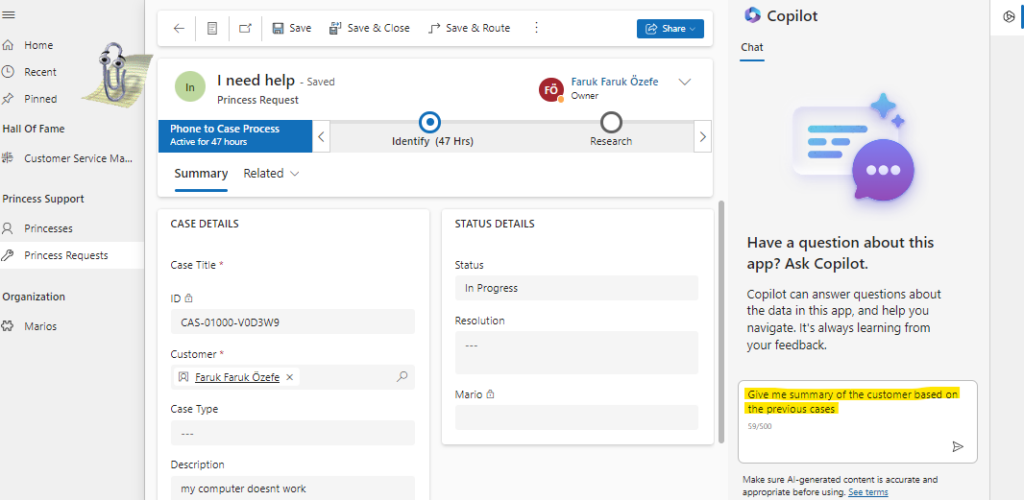
Embedding numbnut – for embedded copilot in Model-driven app
Stairway to heaven – for using Azure AI Studio, Copilot, Blob storage, and in previous articles also Azure Function, WebApp
Our solution includes the latest features of the PowerPlatform and Azure connection the Low and Pro code approaches together, to allows you to boost the performance of resolving the cases by using some insights from the Copilot.
The business use case is about complicated cases when we need external consultancy and assistant, so task is to find the suitable Marios-consultants according to the customer request, by searching the professionals on the Indeed, comparing their background and experience and finding the best matches. (to find the suitable Marios according to the request.)
The business use case is about simplify the KYC(Know Your Customer) process by using unified workspace for all operations. From Indeed we can understand the company background,do semantic analysis of the comments to have insights on how technicians can approach customer (princess) (simplify the KYC(Know Your Customer) process by using unified workspace for all operations.)
The business use case is about analyzing current princess (customer) and her needs based on the Indeed. The data that we were able to retrieve contains open job postings, company in for, recent news and personal profile info. Based on this information, we can suggest more other services and provide information to sales and marketing departments. (analyze current princess and her needs based on the Indeed profile and suggest more other services.)
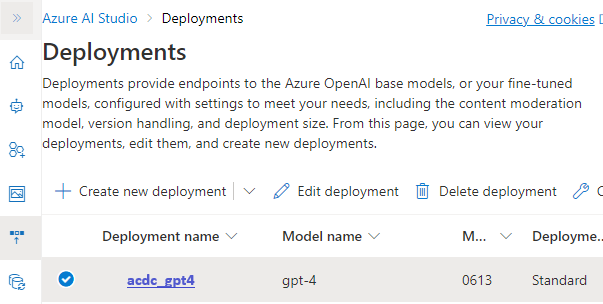
We deployed GPT-4 model to our personal instance using AI Studio, then fine-tuned it with company’s internal data and data from open sources like Indeed, Glassdor or proff.no.
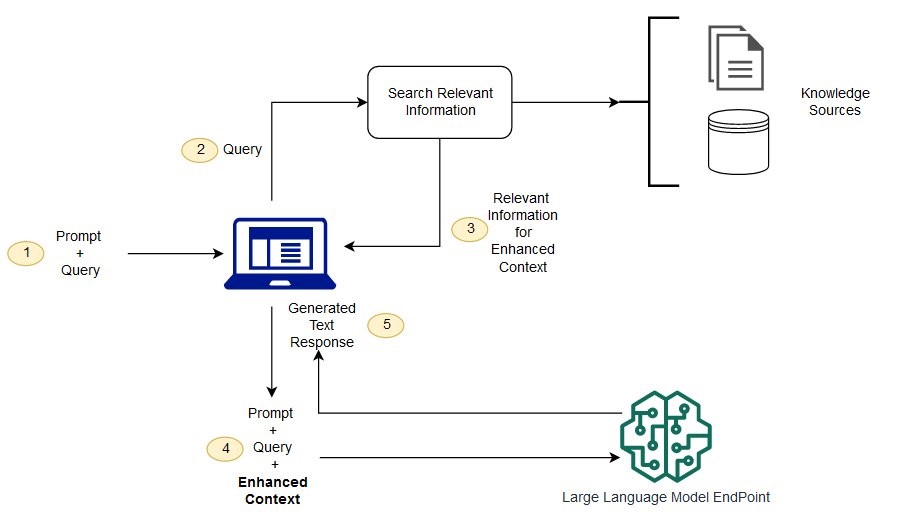
With RAG, the external data used to augment your prompts can come from multiple data sources, such as a document repositories, databases, or APIs. The first step is to convert your documents and any user queries into a compatible format to perform relevancy search. To make the formats compatible, a document collection, or knowledge library, and user-submitted queries are converted to numerical representations using embedding language models. Embedding is the process by which text is given numerical representation in a vector space.
AI Studio has seamless integrated feature use Azure Blob Indexer to implement search functionality search for AI. It bring the possibility to simplify the access to the Datalake from LLM side.
By implementing multiple connectors to the third-party services and data sources, together with Dynamic chaining feature of the Copilot it gives cleaner user experience for the user using only one tool for analyses.
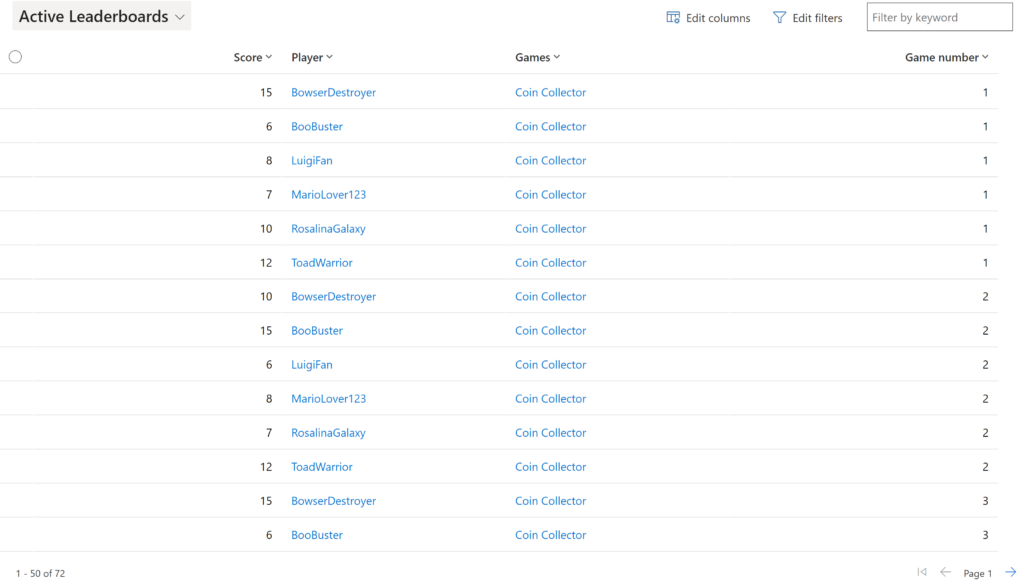
Dataminer – for using dataverse as a datasource in Power BI, with data from the games.
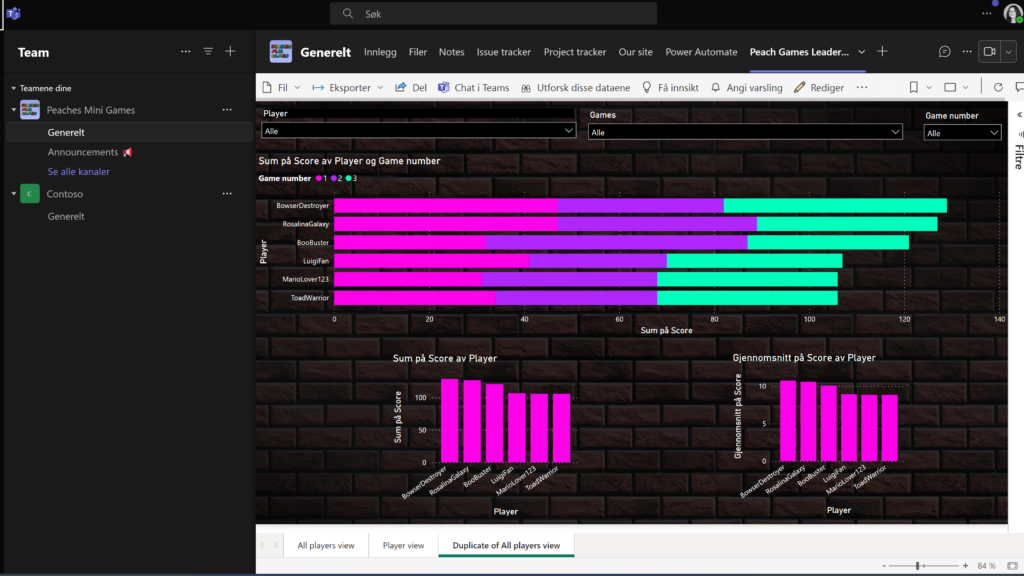
Plug N’ Play – for embedding the Power BI report into teams.
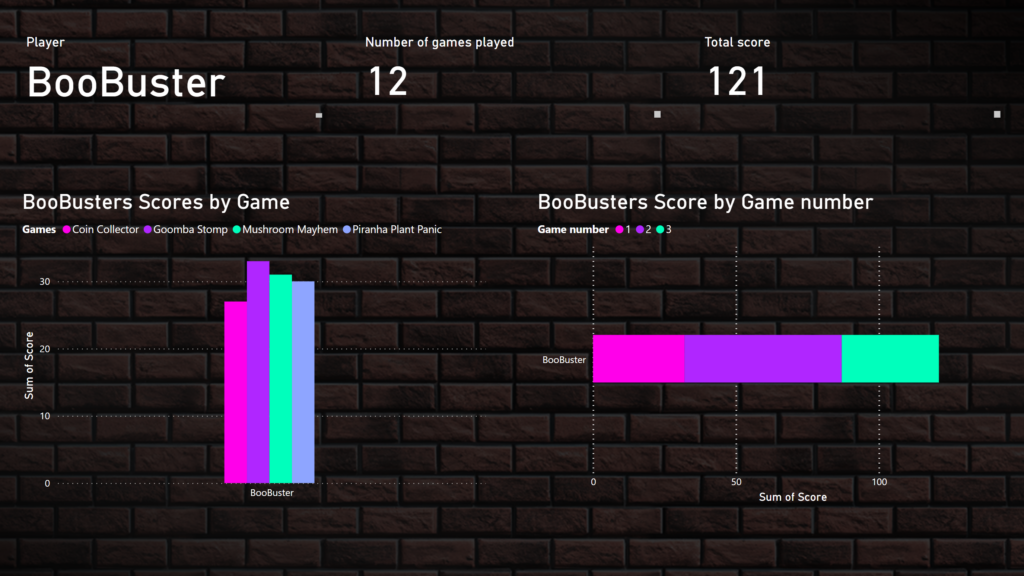
The data from the Power BI report is coming from a table in dataverse called “Leaderboards”. You have the score of each player for a certain game, and what number of try there was for that game. We then use this data in the Power BI report to show all of the players score in a dashboard. There is also the possibility of seeing one specific players data. Which is of course presented in the same graphical theme as the other apps.
And of course it doesn’t stop there. We then also made sure to embed the Power BI report into Teams. Into our Peaches-team where we can then keep track of the players progress. The report addresses a crucial business need by allowing us to efficiently track and analyze the progress of players in the various games. We can then make data-driven decisions, like seeing which game the kids find more fun and entertaining. This can then be used to further develop games for the kids, and enhance their learning experience. Which will allow us to constantly evolve and improve.