Dashes and numbers

Før Bombshells bygger det store dashbordet som viser data fra sensorene som ligger i Oslofjorden, så ønsker de å bygge kompetanse. En lavthengende frukt var da å sette Donatello til å lage et dashbord med et dataset som allerede var på plass.

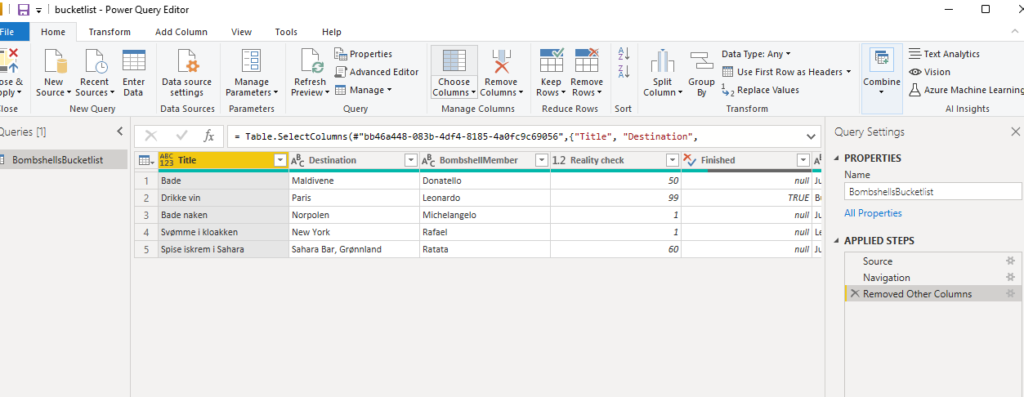
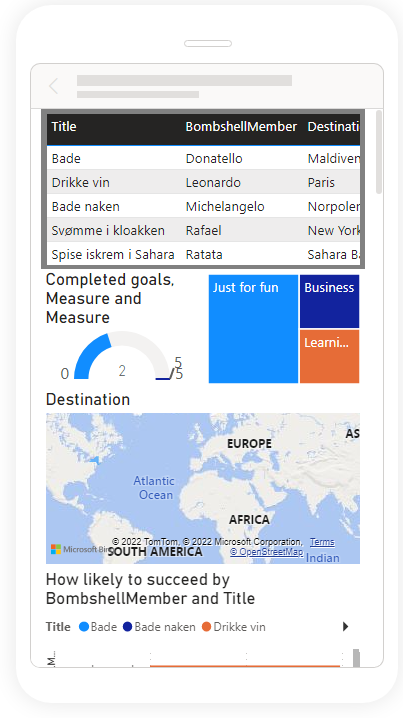
Donatello drømmer stadig om å bade i Maldivene og jobber hardt for å nå dette målet. Han har nå hentet ut data fra SharePoint som han har brukt for å bygge opp en PowerBI-rapport.
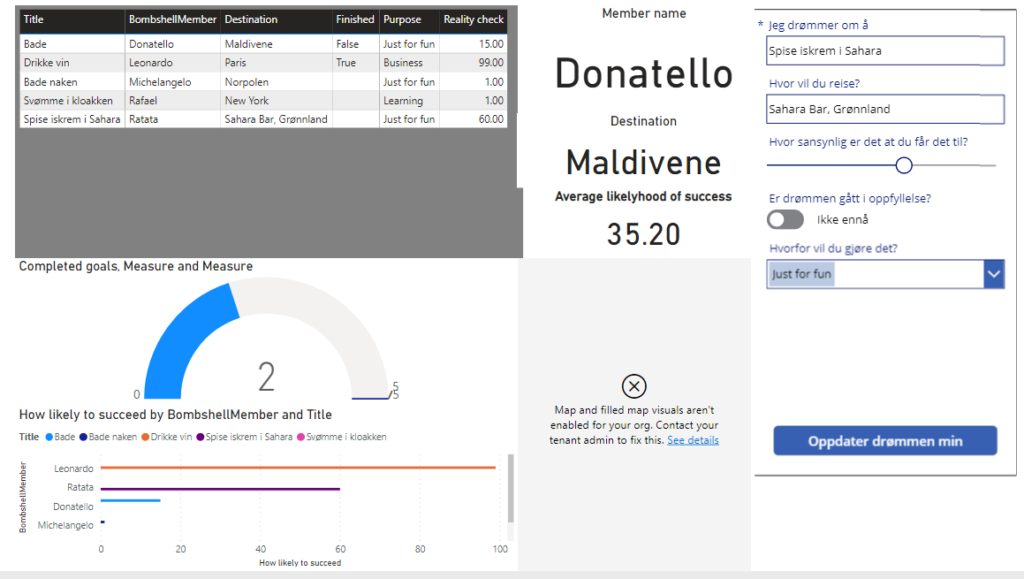
I rapporten har han lagt inn en tabell som inkluderer alle innleggene i bucketlisten. Her finner vi nøkkeldata som hva de ønsker å gjøre, hvem som har målet, hvor de skal og ikke minst hvor sannsynlig det er at målet nås. I selve rapporten er det lagt inn grafer som filtrert på valg i tabellen viser gjennomføring, Hvem som ligger best an til å gjennomføre drømmen, kart som viser hvor men ønsker å reise og hvilke kategorier som er representert.

Sammen med en PowerApp hvor brukerne kan redigere målene direkte fra rapporten, legges det hele inn i et dashbord som deles sammen med hele teamet gjennom Bombshell sitt workspace.
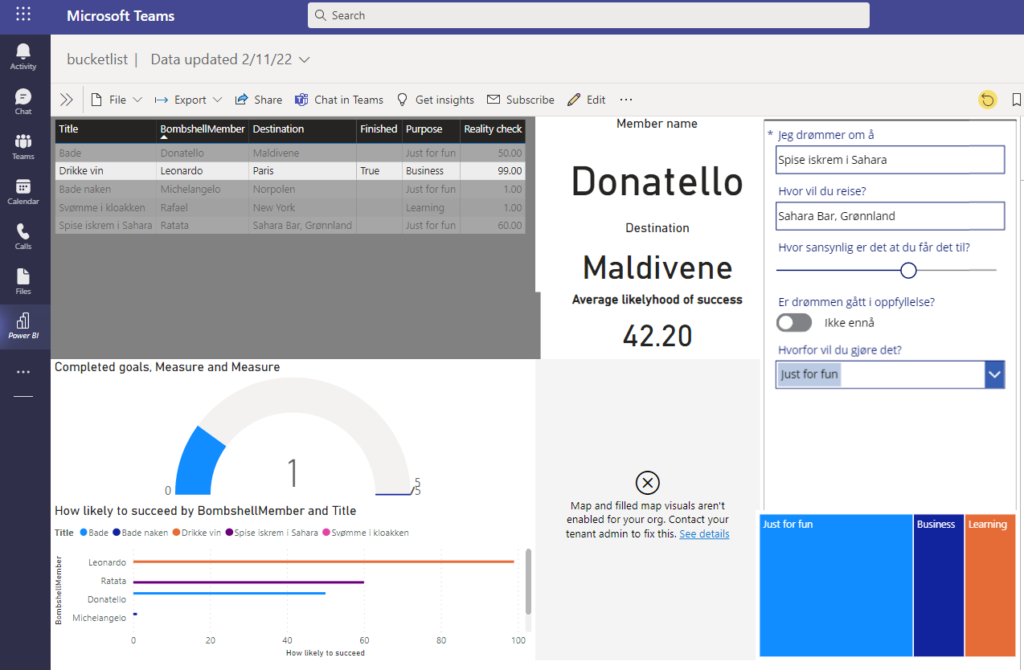
Og for å mota litt ekstra “kredd” fra gjengen sin, har Donatello lagt inn det hele i Teams
Til slutt tar vi med hvordan rapporten ser ut i mobile view hvor elementene er lagt opp tilpasset mobilvinduet og fyller tilgjengelig plass deretter.
Go with the Flow!

Why wouldn’t you want to save time on a process that can (and to be honest should) be automated in all companies that uses Dynamics?
We have now created two different flow, where the first one creates a Azure AD user atomatically when you hire a new employee in Dynamics HR, and mark that the employee should have a user in AAD (Goes without saying, but for you that now wants to ask the question, yes, the flow assigns the created user to a group as well):

But why should we stop there? How many times haven’t new employees showed up at their first day of work, just to se that someone has forgotten to import you AAD user to the system, so you can’t log in? Don’t worry, this flow runs every night, finds the employees that have their first day of work the coming day, and gives the AAD user the right to log in to Dynamics 365 HR:

Hipsters dreamworld

We are making some improvements in the solution with the help of 2 technologies that we think might be considered for he Hipsters badge. They are:

  1. Azure IoT central V3 (Preview) connector: This allows us to send commands back to the devices from IoT central. Perfect for the business flow.
  1. Metamask plugin for login: We are working in a solution for end users where they can log in to a page and see real time data flowing into graphs and maps. One of the possible ways to login is by using Metamask as a Web 3 platform to login to an hypothetical blockchain that could work as decentralized data repository for members of ZOOs. (read more here: https://docs.metamask.io/guide/). This feature is in an experimental phase, but the POC is working good.

Happy coding!

HTML is great!!

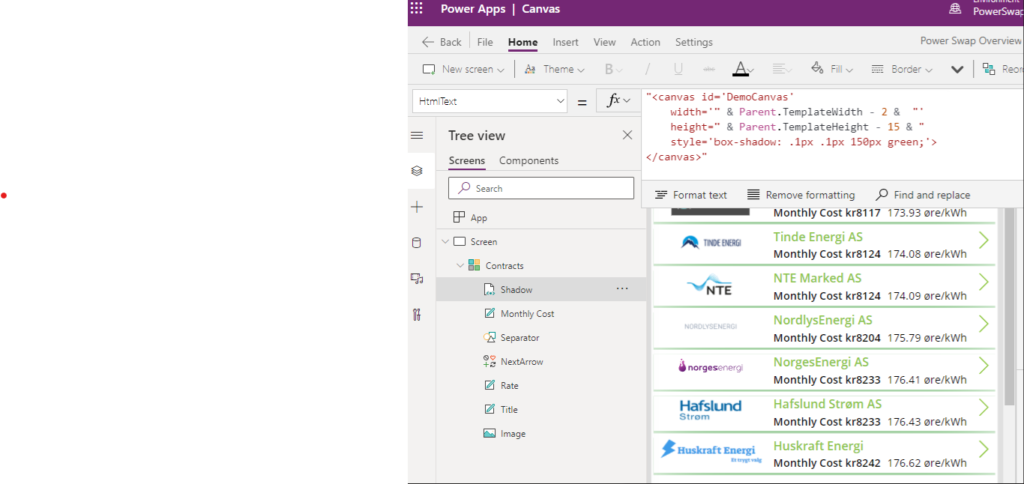
We have used HTML5 inside Canvas App to add blurry line shadows between each contract in the list.

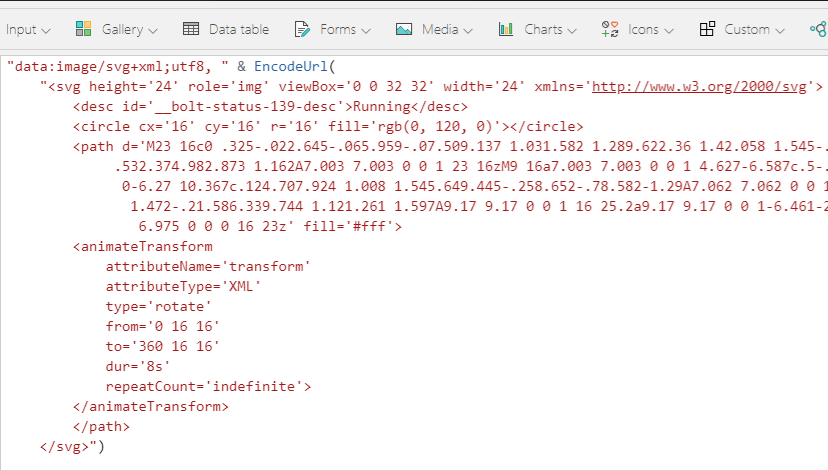
In order to symbolize reusable energy, we needed to add a rotating image that scales.

This is not possible in a canvas app without some custom HTML

The solution was SVG tags

Straight up and away!

Power Automate Flow er en kraftfull måte å kombinere businessflyt og integrasjoner med andre systemer. Gjennom å bruke connectorene mot ulike apier, både Microsoft og tredjepart, klarer vi å håndtere notifications, innhenting av brukerdata og utsending av epost i samme logiske flyt.

Når det blir opprettet en ny record i dataverse med sensor data for en enkelt sensor, blir det gjort et HTTPS som starter en ny flyt.

Denne flyten henter først brukerprofilen til en Office365 konto, det blir sendt en e-post til denne kontoen om at en ny trussel er oppdaget på sensor lokasjon (Oslofjorden) også sendes ett dynamisk kort til en chat i Teams.

På det dynamiske kortet har du muligheten til og sende ut Ninja Turtles for og håndtere trusselen. Kortet oppdateres når Ninja Turtles sendes ut.

Her har vi brukt Office365, Outlook, Teams og Dataverse connectoreren. Hver av connectorene kommer som standard-komponenter i PAF og bruker Microsoft sine APIét på baksiden. Dette er til brukerens glede skjult og bruker connection med brukerinnlogging.

Preview <3

Since the tenant for our Demo environment is located in USA, we do get accsess to some functionality that is not yet available here at this side of the ocean.
Therefore, for us how embrace the LowCode/NoCode functionality, we just love the way you can write what you want to do directly in the PowerApp with AI-powered assistance, and the suggestion for the code that should be used pops up right under it!

Dashboard for end customers!

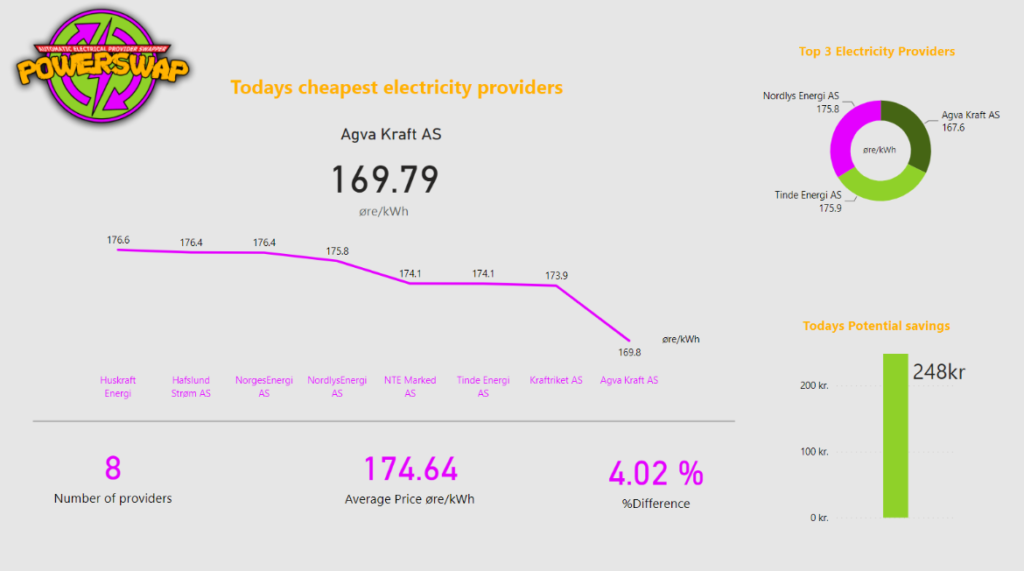
We have created a great-looking dashboard with three pages for potential and current customers.

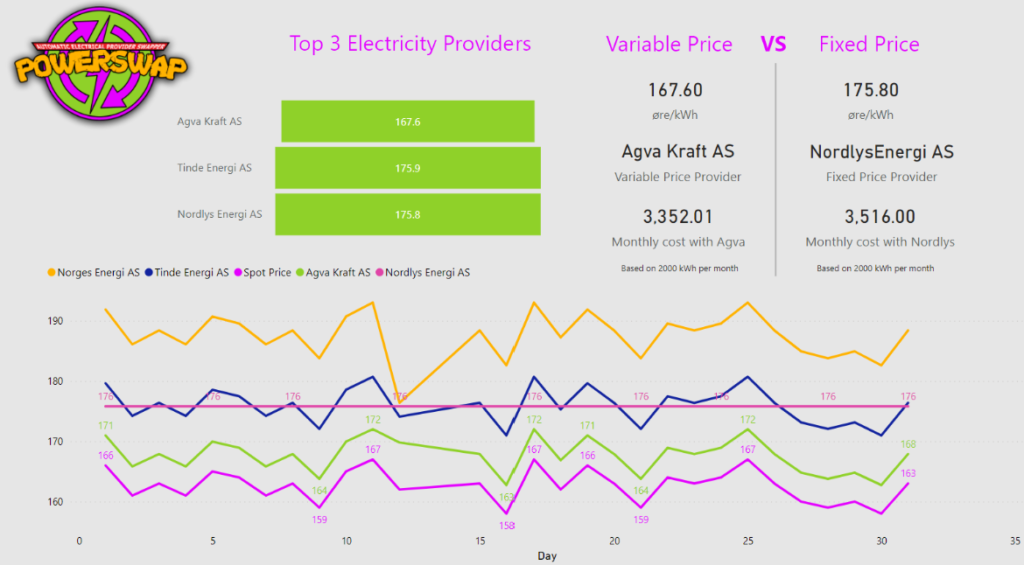
“Today’s Overview” page are showcasing today’s electricity price and the provider with the best and lowest price. It is easy to compare between electricity providers and get an overview of how today’s market behaves. You can also see your maximal potential savings.

The “Electricity providers last 30 days” page gives the customer an even greater overview of the current market situation. All the electricity providers are matched up against the Spot Price, and it is easy to spot the providers with the biggest fees. We have also included a comparison between the cheapest variable price and the fixed price.


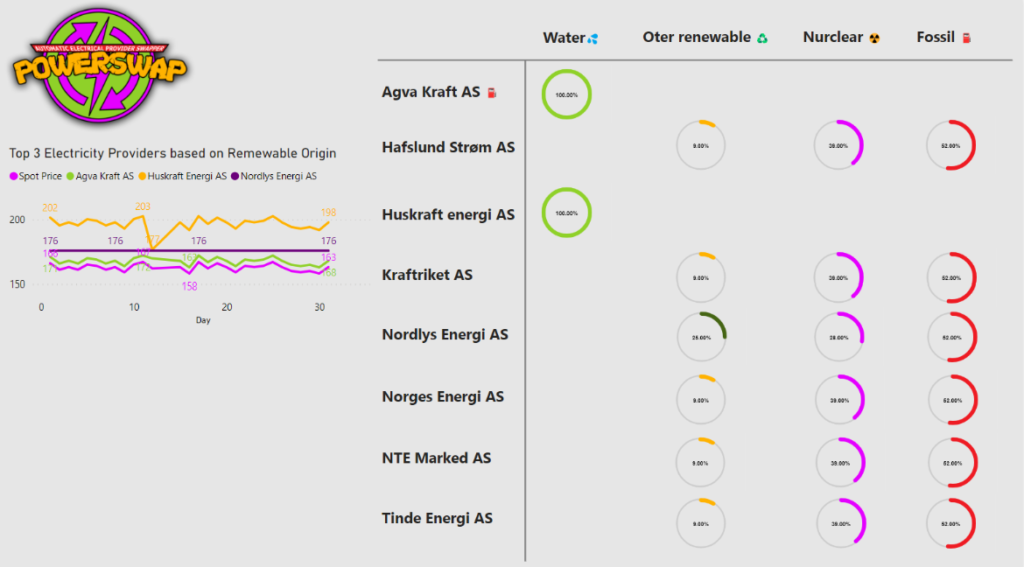
We have created a great-looking dashboard with three pages for potential and current customers. “Today’s Overview” page are showcasing today’s electricity price and the provider with the best and lowest price. It is easy to compare between electricity providers and get an overview of how today’s market behaves. You can also see your maximal potential savings. The “Electricity providers last 30 days” page gives the customer an even greater overview of the current market situation. All the electricity providers are matched up against the Spot Price, and it is easy to spot the providers with the biggest fees. We have also included a comparison between the cheapest variable price and the fixed price. The “Energy Origin” page gives you an overview of where the electricity is generated between the providers. And to the left in the graph, we can analyze the top three providers with the most renewable electricity and compare it to their electricity price

Shell is power!

Can you feel the power of this?

In order to ship our components from development to prodction we have leveraged several technologies.

Dataverse

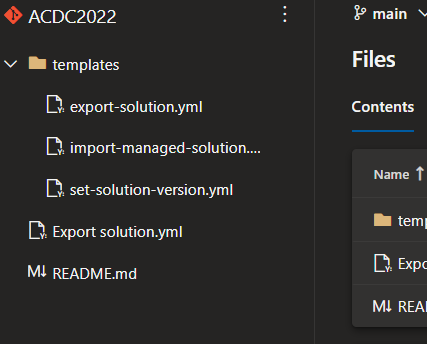
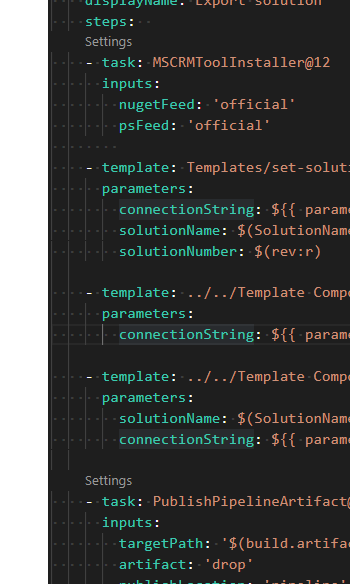
In order to export our solution for dataverse we have built a set of yaml based pipelines in azure devops. We have isolated the tasks to their own separate template files which are then called when needed, allowing for simple reuse of functionality.

Azure

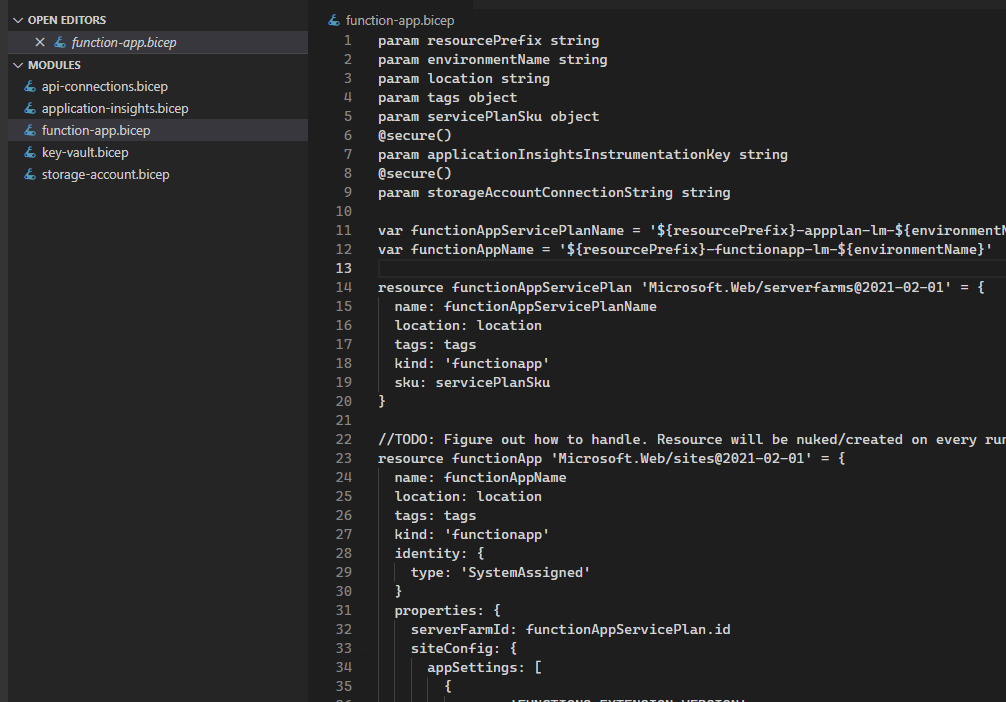
To deploy our azure resources we have used bicep instead of armtemplates. These are leveraged in azure devops pipelines. We have created templates for the individual types of components as illustrated below.

Viva Connections and a nasty hack – because UX frigging matters!

When our turtles aren’t swinging around New York City or munching on their favorite past time food of pizza’s – they are checking in on the TMNT HQ Intranet to see what’s happening, or chatting with other crime fighting colleagues in Teams.

Using a Home site via Viva Connections is the best way to do this, but unfortunately there’s a bug where the home site shines thru the navigation menu and breaks the user experience.

Quickest way to solve this? Contact Pizza Times trusted member Mikael and have him install the swizz army knife off all time – https://github.com/pnp/sp-dev-fx-webparts/tree/main/samples/react-script-editor. With a simple accessibility script in place, things are back to normal.

Script to fix the order of business

(Thieving bastard badge is attributing to other 3rd party usage in the solution – API’s etc)