This blog post covers what we created and the improvements we made on day 3 of ACDC 2022.
The problem
Electrical bills have gone through the roof this winter, and we are sick and tired of scanning the market for cheaper electricity.
The solution
We created a solution to this problem! The PowerSwapCorp!

When you sign up as a customer you give us power of attorney to swap electricity contracts for your home. We scan the market and swap to whatever electricity provider has the cheapest rates. All we ask for in return is 10% of your total savings each month.
Before becoming a customer
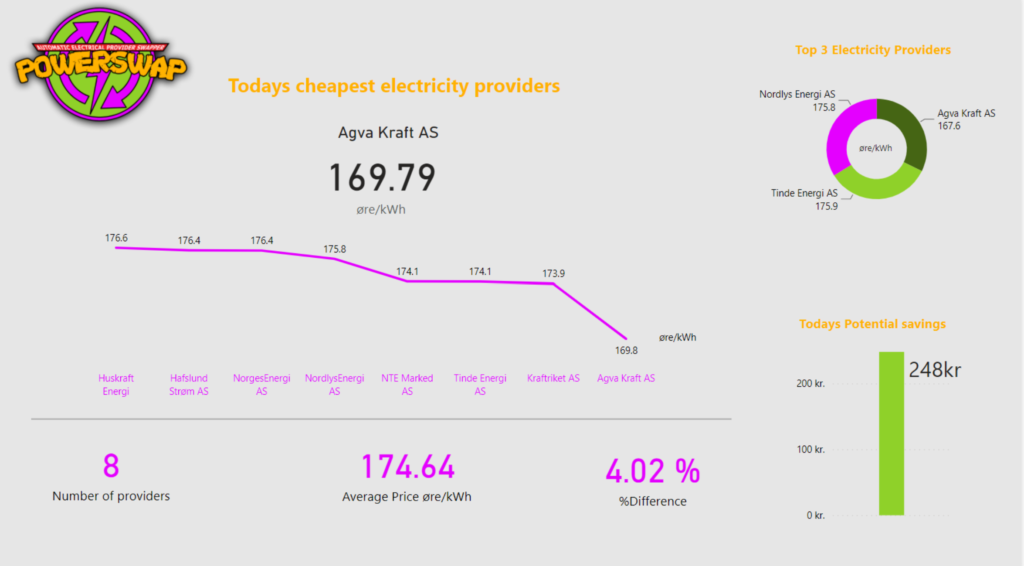
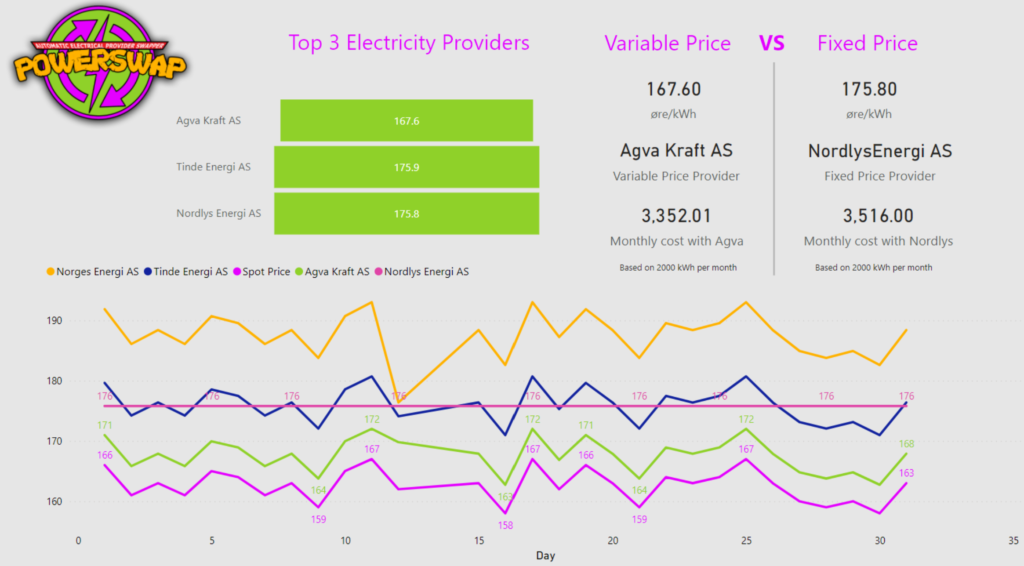
Before you might become a customer you would like to get an overview of how we classify all the electricity providers. In the Power Swap Dashboard, you would see today’s cheapest provider as well as a 30-day overview of the market. The reason behind these dashboards is to give the customer an idea of how well we know our data and the electricity market.
Excellent User Experience:
These dashboards give a unique overview of how the market is today and tell a story to the customer on how we manage the data. The user experience of this dashboard is easy to manage and has an intuitive layout, even for the less educated customer.
Most Extreme Business Value:
The Dashboard let the customer themselves take the decision if our services can save them money or not. The intuitive layout and real-world scenarios (Variable price vs Fixed price) will convince the customer without interaction from our sales team.
Rock Solid Geeknes:
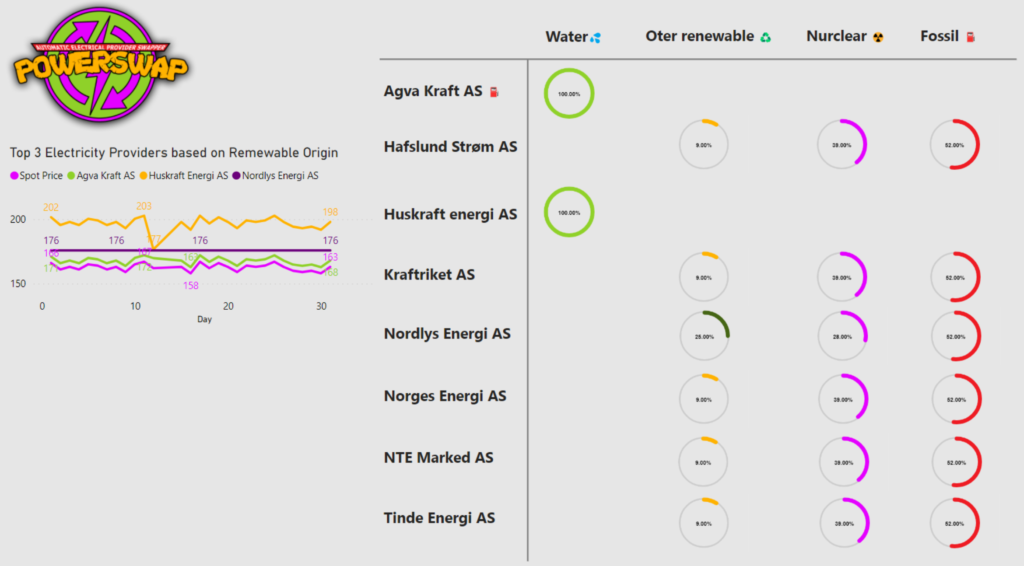
Showcasing where the electricity providers generate the electricity from is a great tool of data and technology for the data geeks and even for the climate activist geeks. Who would really like to buy electricity without knowing where it comes from? 😉
Killer App:
It is not that common for the electricity providers to share their data to the extent of what we have done here. This is clearly the best platform for providing all the data the customers and potential customers deserve. #ShareWhatTheCustomersDeserve
Our website
Visit https://powerswap.powerappsportals.com/
or scan this QR-code:
View our offering and an overview of what you can save by signing up for our service.
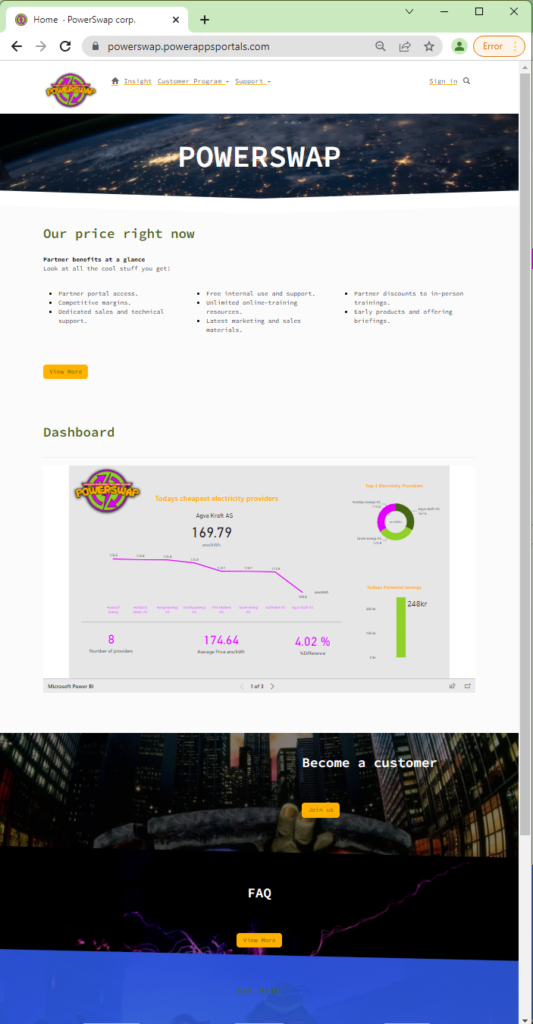
Even before you sign up to become a customer you get insights into embedded Power BI reports that show details on how the electricity market is doing.
Excellent User Experience: By having a consistent visual identity across apps and the website as a hub for user interaction we create a strong brand. The language and visuals should annotate a young, tech startup that wants to disrupt its industry.
Most Extreme Business Value: The website will provide business and win customers over by providing information on how much money they could save by using our services. The customer can log in, register support tickets, and communicate with the back office team.
Rock Solid Geeknes: The embedded Powerbi reports combine data from different sources and provide intelligent insight into the weather conditions impact on different types of electricity production.
Killer App: The portal is accessible and responsive, works on mobile devices, and will (when the preview feature allows) be available as a native app on your phone.
Become a customer
Becoming a new customer is easy. You can click the “Join Us” button on the front page or simply go to “Sign in” in the main menu. You can register by choosing the authentication provider you prefer: Microsoft, Google, or Azure AD for internal users.
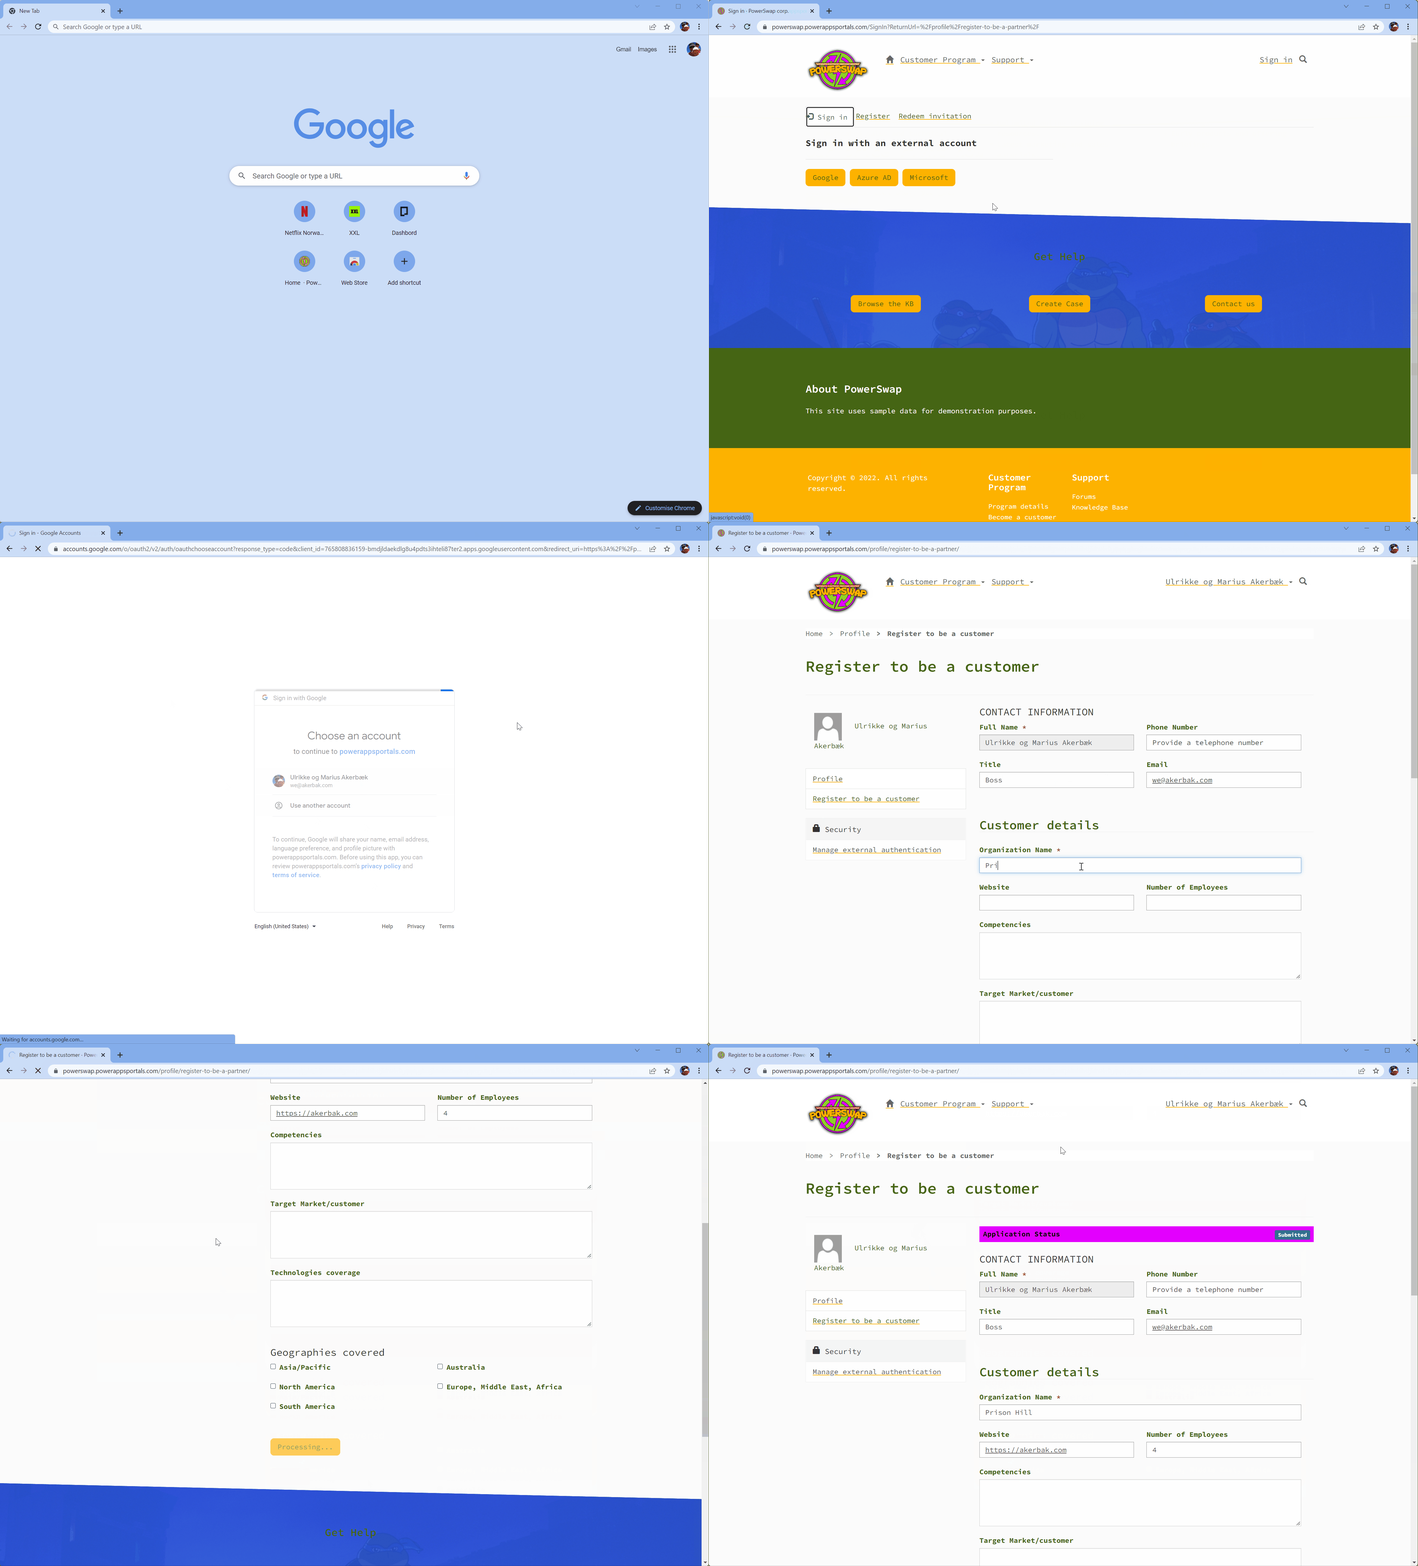
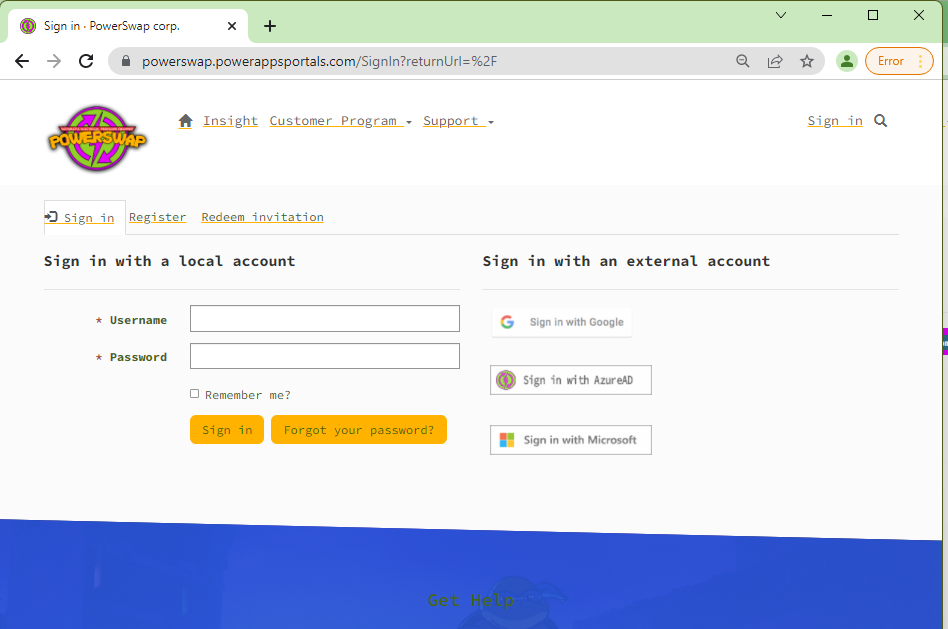
Excellent User Experience: You can choose an authentication provider and connect website login to a familiar service. This provides a smooth user experience as you don’t have to remember a new set of usernames and password combinations.
Most Extreme Business Value: By letting new customers register through self-service we create more business than if it was only salespeople doing the signing of contracts.
Rock Solid Geeknes: Automatic self-registration and multiple identity providers are kinda geeky.
Killer App: Its killer cool that we use other authentication providers – we could have just left it with username and password..
Terms and Conditions
When you sign up the first time you’ll need to sign our terms and condition.
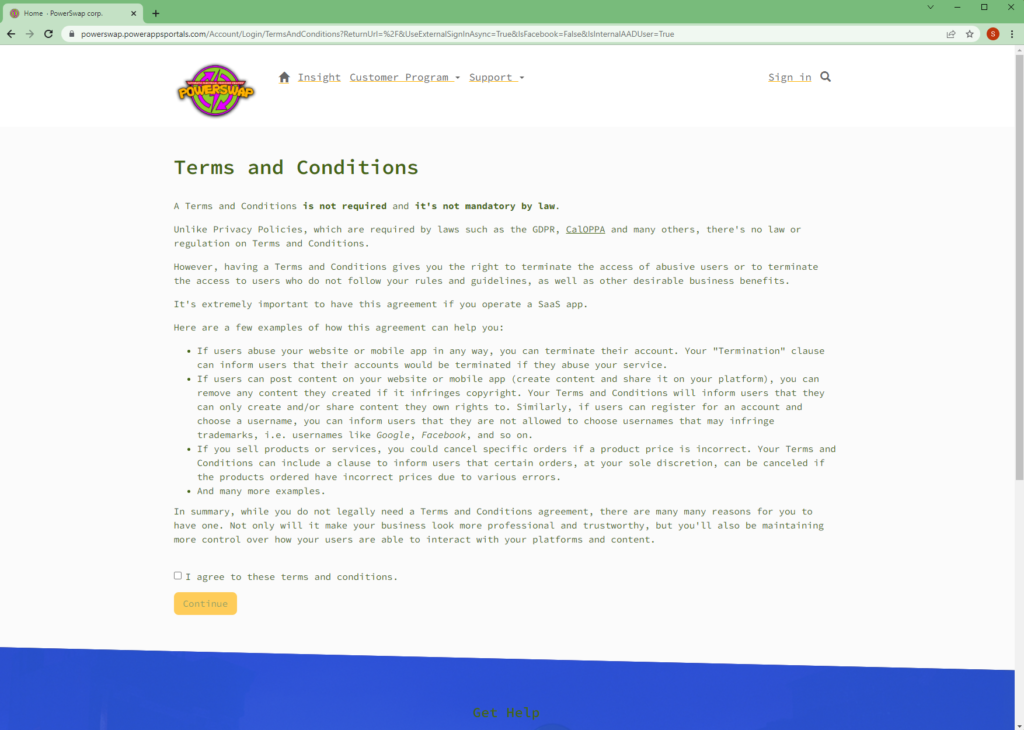
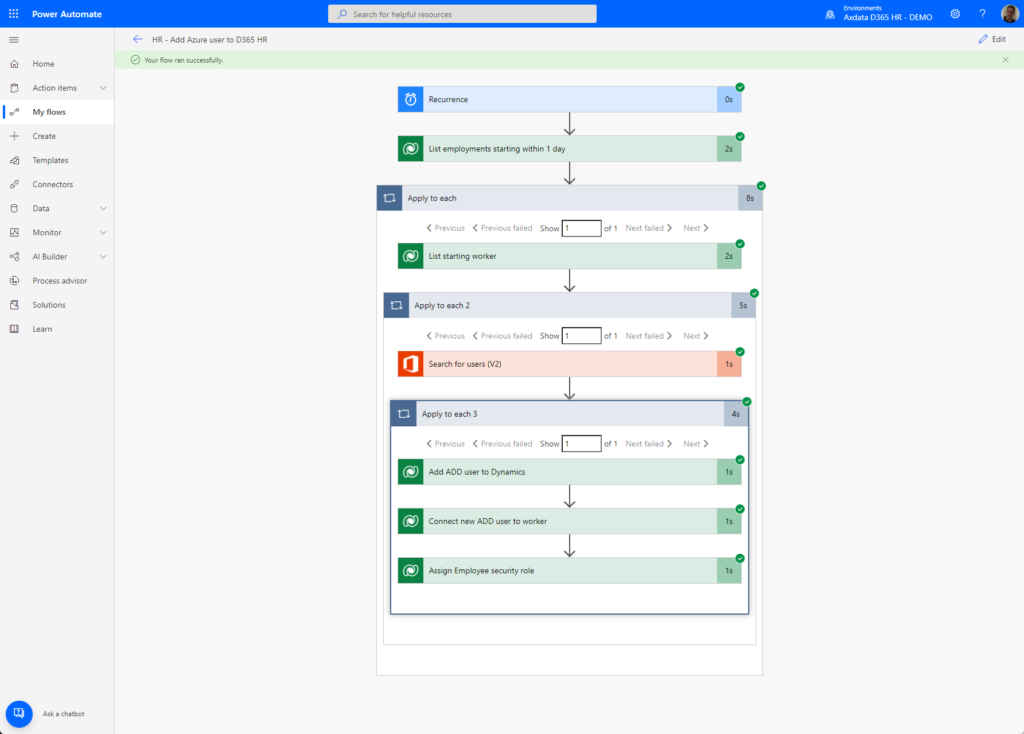
You need to checkbox before the button is enabled and you can submit the form. This is our way of getting your consent to switch contracts for you. When the terms and conditions are signed a flow automatically creates a document and uploads it to Azure Blob Storage.
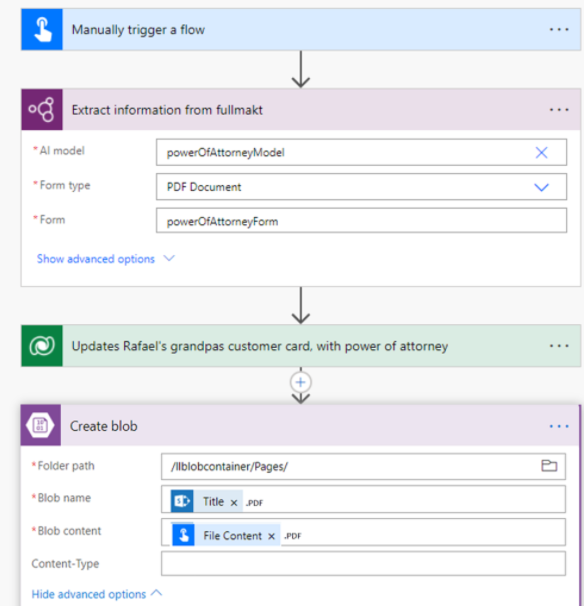
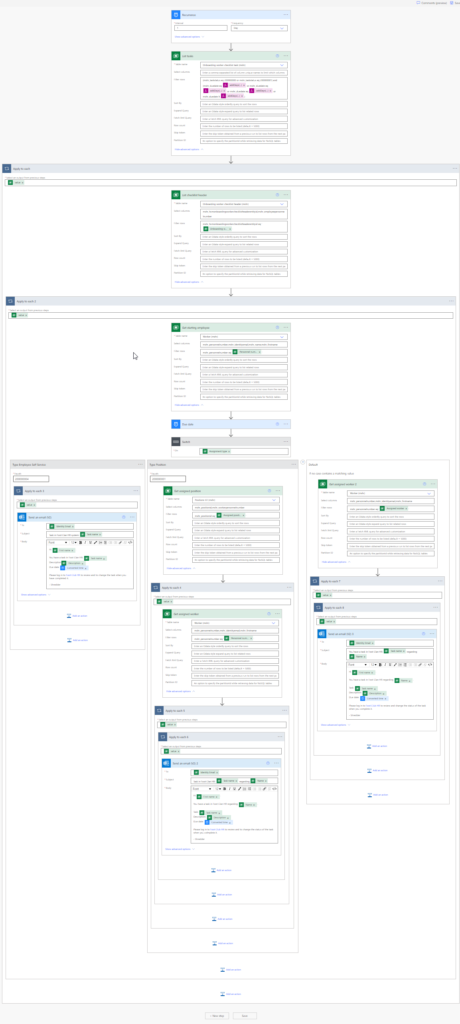
This is a screenshot of our flow that stores power of attorney documents into blob.
Excellent User Experience: The button for signing the Terms and conditions will only be enabled when the checkbox is checked.
Most Extreme Business Value: When customers sign terms and conditions they give us legal rights to do business on their behalf – that’s trust – and trust is money… (or was that time is money..?)
Rock Solid Geeknes: Automatic creation and upload of documents using Flow are geeky.
Killer App: We are creating a solid app ready to go with all these security and legal steps taken care of.
Customer Application
When you are logged in you will be sent to the customer application form. This is where you enter the details we need to create a customer contract. The applications are sent for approval to the back office.
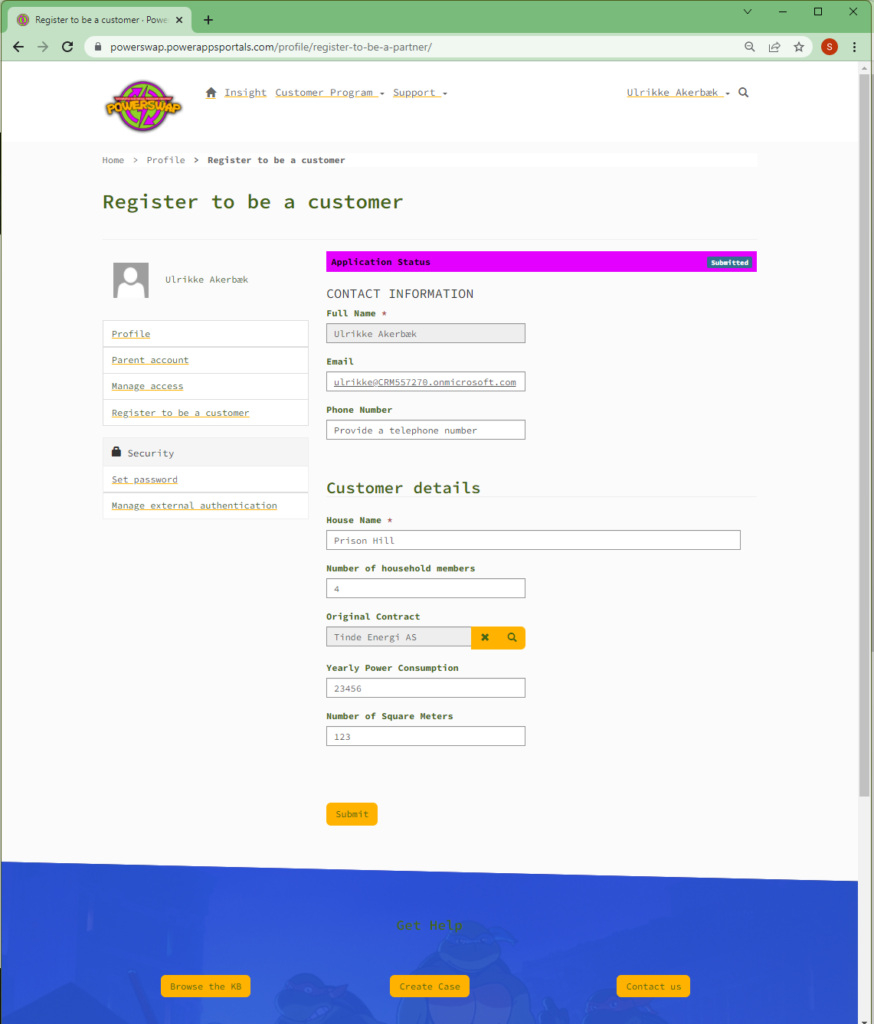
In the application form, you are asked to enter your contact information and information about your current electricity provider.
Excellent User Experience: We combine the form for entering your contact information with the application form to make sure we are limiting the number of forms and steps to become a customer.
Most Extreme Business Value: Users can sign up to the portal without sending customer applications. This will allow us to follow up on contacts that are interested in our product.
Rock Solid Geeknes: This application step allows us to have automatic flows that follow up contacts without applications, as well as those that are already customers.
Killer App: This application process is tying nicely with the rest of the app.
If you are unsure about your current square meters, you can use our mobile app that allows you to measure the space around you and it will calculate the amount of power it consumes.
Power Consumption Calculator
We created an app for customers that are unsure about the size of their homes. Now they could open our app, use the camera to pin a couple points to the floor in augmented reality, and get square meters calculated. You also get yearly consumption based on square meters.
Excellent User Experience: A super easy app that does exactly what it made for
Most Extreme Business Value: For the user, knowing the consumption is key in order to predict how costly the energy bill we are. For us, additional apps and tools are a marketing tools to brand ourselves.
Rock Solid Geeknes: Augmented reality! Just playing in the app measuring all and everything is just fun!
Killer App: Combining excellent user experience, with business value and geeky AR/MR is the definition of a killer app
Help Desk
Once you are a customer you will have access to knowledge articles, forums, and the help desk. This is where you can raise support tickets and get help from our back-office support team. From the main menu open “Support” and choose “Help Desk”.
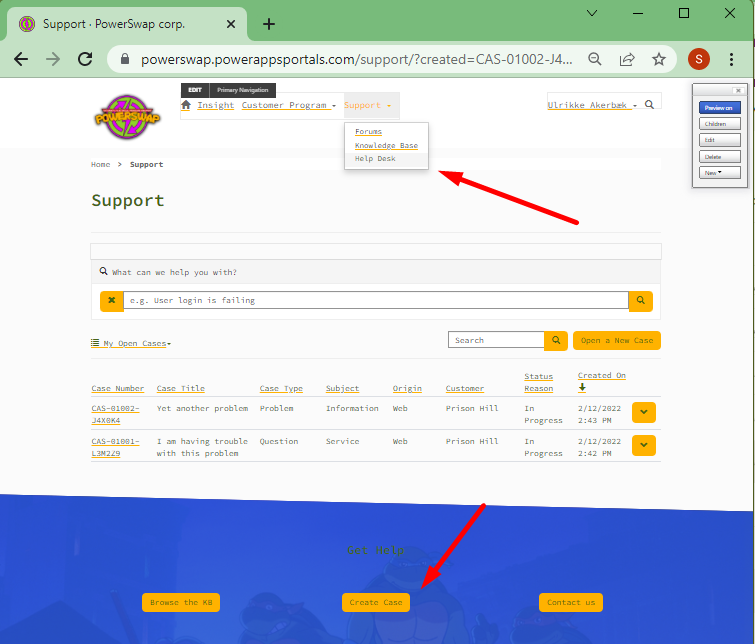
This takes you to an overview of your support tickets where you can see your active and closed cases. You can also create new cases by clicking “Create a new case” at the top of the list, or using the “Create case” button that you find in the “Help” section on most pages in the website.
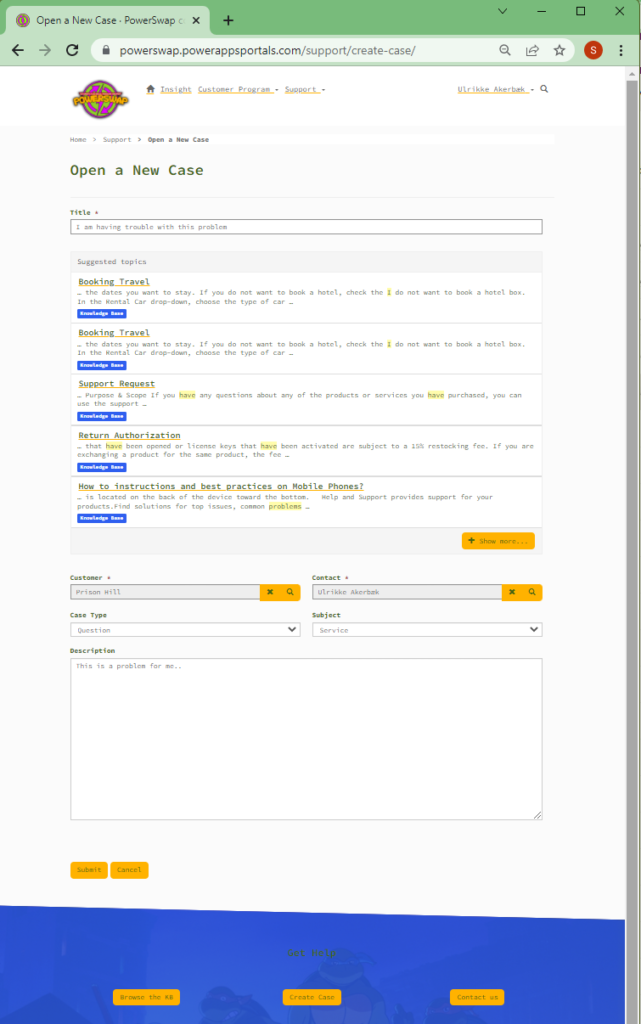
When you create a case you’ll automatically get suggestions to possible answers in the knowledge base articles and other information pages on our site – based on the words you type in the title field. Further, the name of your house and your name is automatically related to the case. You simply select the type and subject and add your description and send the case to us.
Excellent User Experience: The experience of creating a case and being presented with possible solutions before the case is created provides a good user experience – and takes some load off the support team.
Most Extreme Business Value: By solving some of the problems users are having before they create support tickets the support team can focus more on the big problems.
Rock Solid Geeknes: It’s pretty geeky to predict the answer to a problem in a support ticket before it’s even submitted!
Killer App: This has the taste of AI and has predictive qualities that make for a great killer app..
Sales Person App
Our salespeople are on the go and need business apps on the phone. They have a Canvas App that allows them to sign new customers on the fly and approve or reject applications that come in through the web. The website has open registration, and that means that there will be some unserious applications. Because we are signing legal contracts with our customers that allow us to make deals on their behalf, we need to make sure that the applicants are real people – and we like to do that manually.
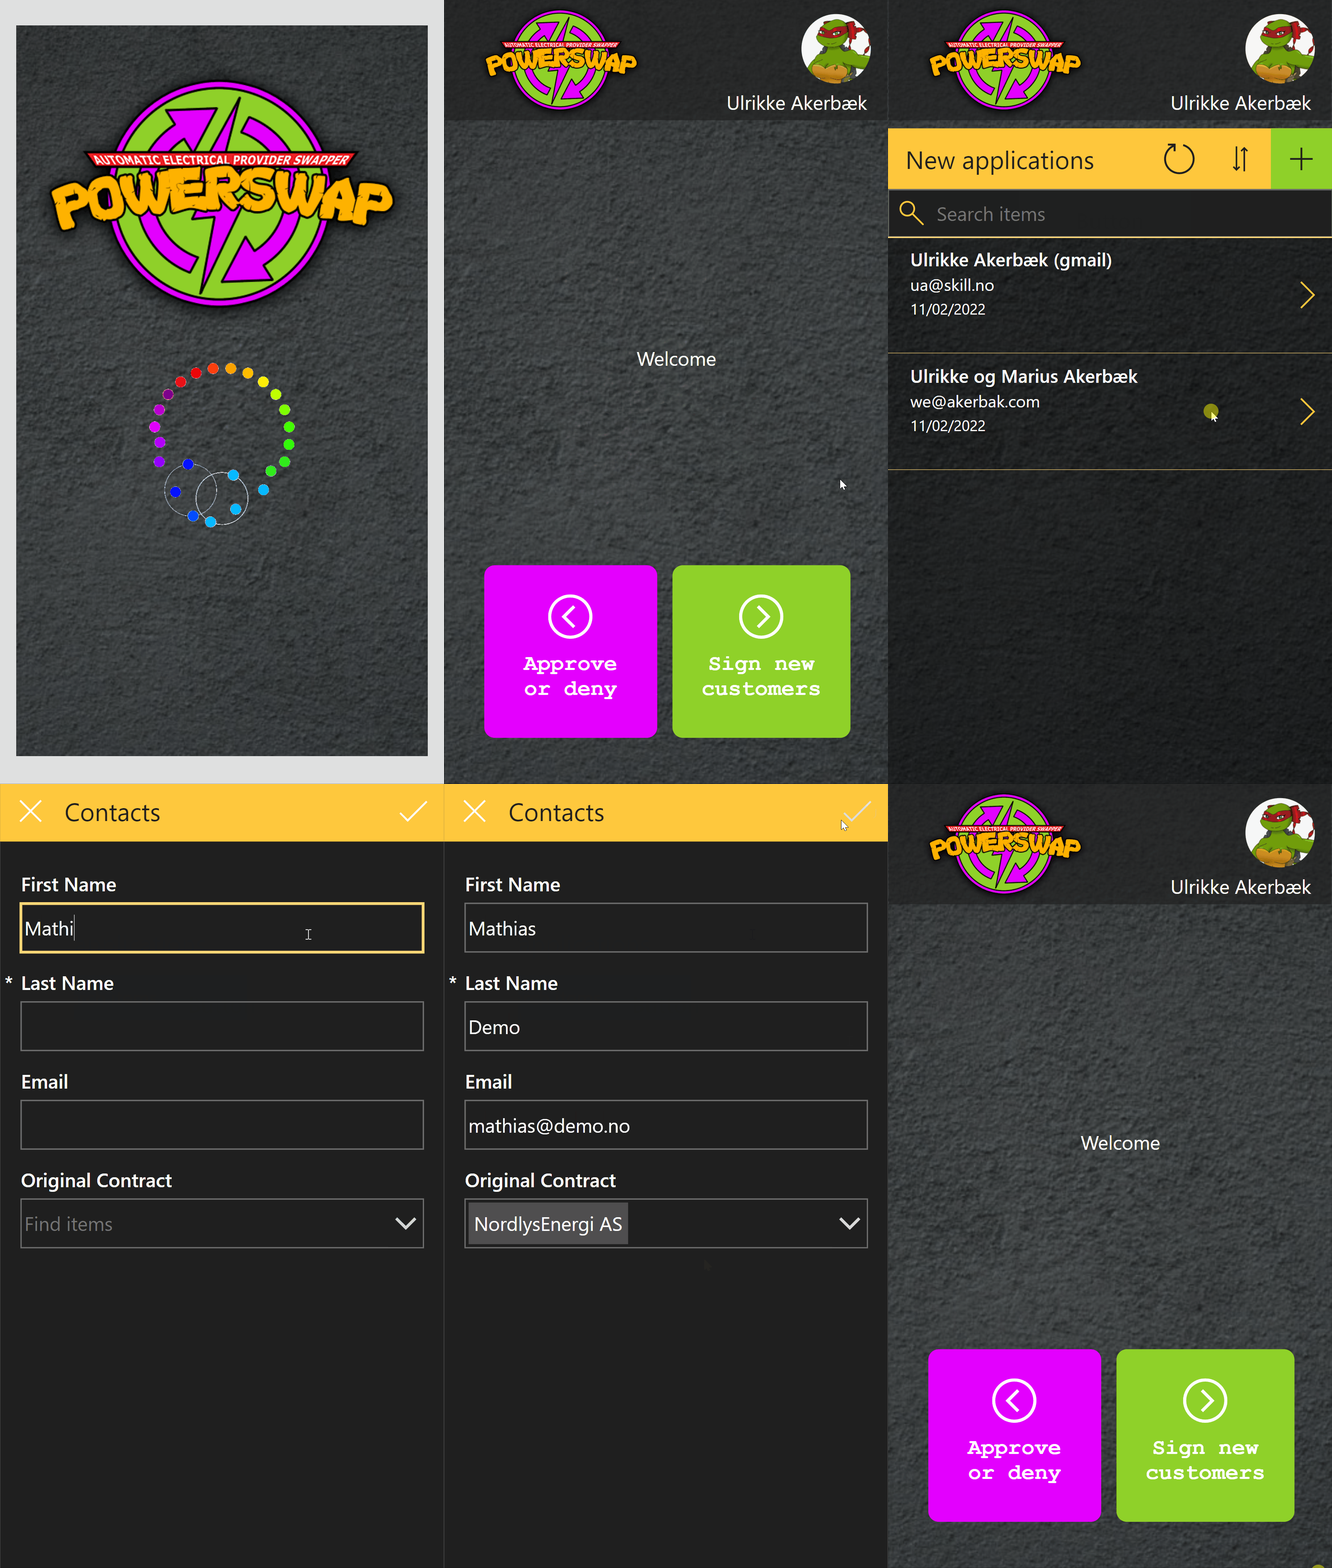
When creating interaction designs it’s good to look for established design patterns that exist and that users are already used to. For example Tinder’s Swipe Gesture. We wanted to use swiping as a way of approving or denying new applicants.
You can see the loading screen that engages the user right away while data loads into the application. At the start screen, you can open the “Approve or deny” screen, or a form for creating new customers.
The “Approve or deny” first shows the list of new agreements to give you a sense of the workload. Then when you open an agreement you can swipe right to approve – get to a success screen – or swipe left to deny – and get to a “successfully denied” page.
You can also create new contacts from the list page. When a seller is on the go it’s important that they easily can sign new contracts.
Excellent User Experience: The usability of this swiping motion is great, natural, and fun. It’s easy on the hand and feels good to the end-user.
Most Extreme Business Value: By allowing salespeople to approve applications on the go we shorten the time from contact submitting an application until it’s approved.
Rock Solid Geeknes: We simply love sliding motions. That’s why we spend all that time on Tinder, you know…
Killer App: Simply having your work tool in your pocket is great for a salesperson. They get their work done on the go and can spend more time closing sales.
Seller Teams
After the registration the customer is created in DataVerse as a contact, using a Cloud Flow we create an approval based on the new contact record that is created. Since this is a power of attorney product we have to approve these manually as of now. This is something we will continue working on with our lawyers.
When the approval is created a message is posted in a team’s channel for all associates in PowerSwap Corp. When the approval is completed and approved, it posts a new message that the contact is now approved.
Once contact is approved, we will automatically assign them the best current deal and their subscription start running.
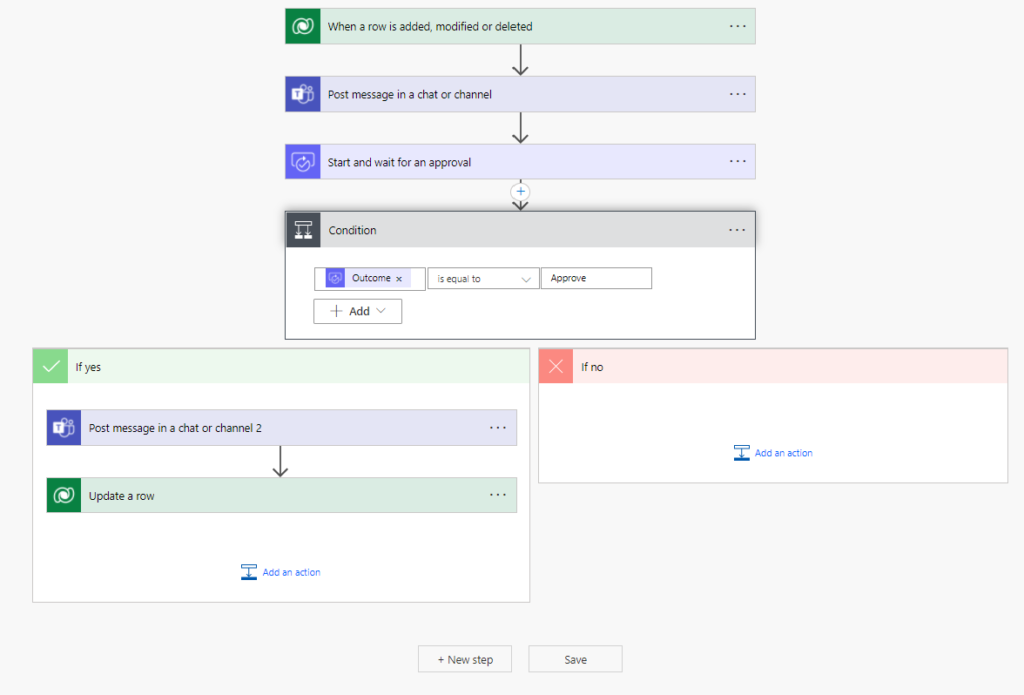
Excellent User Experience
By using approval flows integrated with Microsoft Teams, we continue using the same interface as the associates are used to.
Most Extreme Business Value
Using a Cloud Flow to create the approval and then post it to teams for associates makes it easy to handle for employees. When our manually approve process could be replaced with an automatic solution, we could just extend this Cloud flow with auto-approve.
Rock Solid Geeknes
Using Power Automate Cloud Flow to run the entire process from when a contact is created, going through an approval flow which then is approved using Microsoft Teams is in our opinion use of the best tools and technologies.
Killer App
By using Cloud Flow with approval integrated with teams we believe this will make the work tools of our employees more consistent and reduce the number of tools they have to involve in order to achieve their tasks.
A 360-degree view of the customer
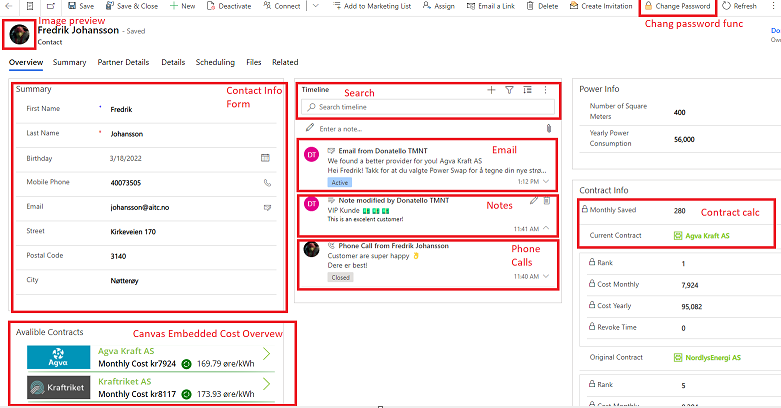
In the Power Swap Business Application, we have a complete 360-degree overview of the customers with all the customer information, preferences, emails, phone calls, notes, current contract, contract swaps, and so on.
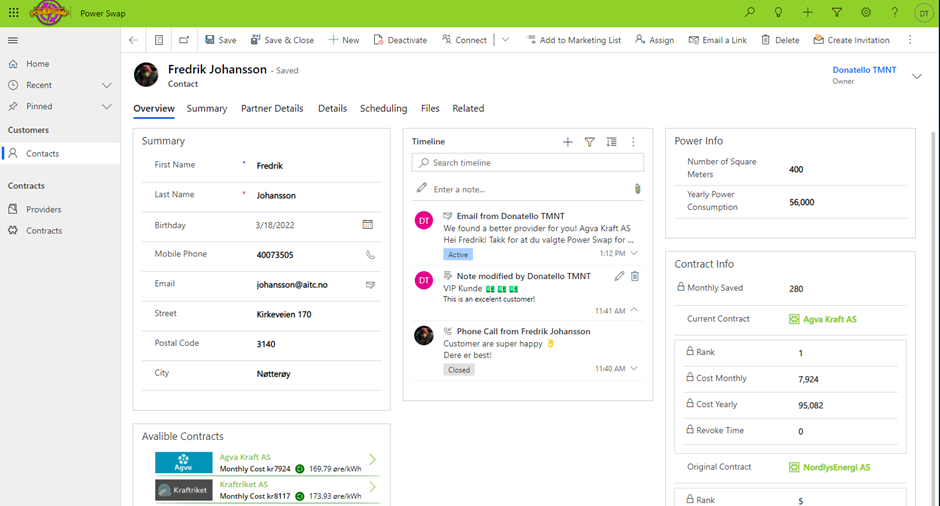
This is an application on top of dataverse where all the current electricity providers and offers are stored. And all the information needed to calculate the cheapest provider and offer for the customers depending on their preferences.
Business value
With a 360-degree overview of the customer we can offer:
- Better customer satisfaction with excellent customer service.
- Personalized marketing activities to decrease churn rate.
- Sales have all the information they to potentially sell other services to the existing customer
Excellent user experience
The user experience is familiar and follows the best practices for form design by MS. Combining the structure and usability of the model-driven app with the tailored experience of the canvas application. Both apps are responsive and can be used on the desired device.
Killer App
This is an application that connects everything, calculating the best possible offer that fits the customer’s preferences and swapping the old agreement with the new one on an hourly basis.
Rock Solid Geekiness
- We used fiddler to decrypt https traffic, and revers engineered an existing service. 🥷
- We took that information and created our own custom connector. 🔌
- To not spend time on creating entities and attributes, we used dataflows to auto create our data model from the payload of the service 😍
Individual customer dashboard
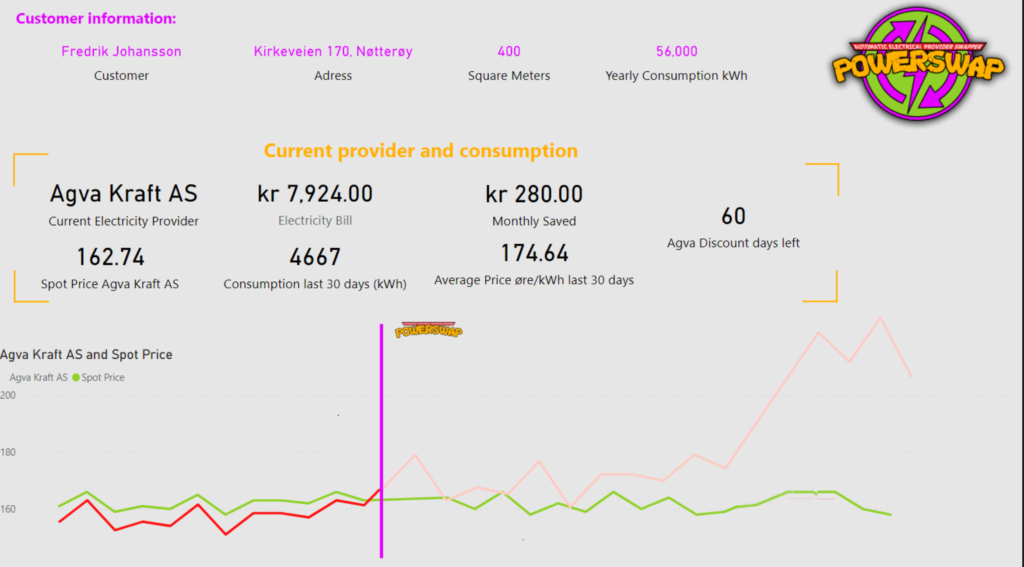
Every customer needs to have an overview of their current situation. In this dashboard “Power Swap individual” the customer has access to their current provers, spot price, electricity consumption, etc.
Excellent User Experience:
This is another appealing dashboard that provides just the right amount of information to the customers. This is a dynamic dashboard that will update the customers with the latest information.
Most Extreme Business Value:
This has a great business value as the customer has one intuitive dashboard to look up its personal data. We believe we have managed to showcase the data in a way that it is easy for the customers to both use it as a personal dashboard, and also share how cool their electricity data is to other friends. They even have data on when “Power Swap” is predicted to switch providers based on discount days left.
Rock Solid Geeknes and Killer App:
To be able to look at when Power Swap is predicted to “swap” provider is a cool tech every geek would appreciate. To get all this data in one dashboard is unique and cool.
More data, please! More data please! Historic Clima and Oil/Energy price
Well.. what can we say? We just love data and correlations.
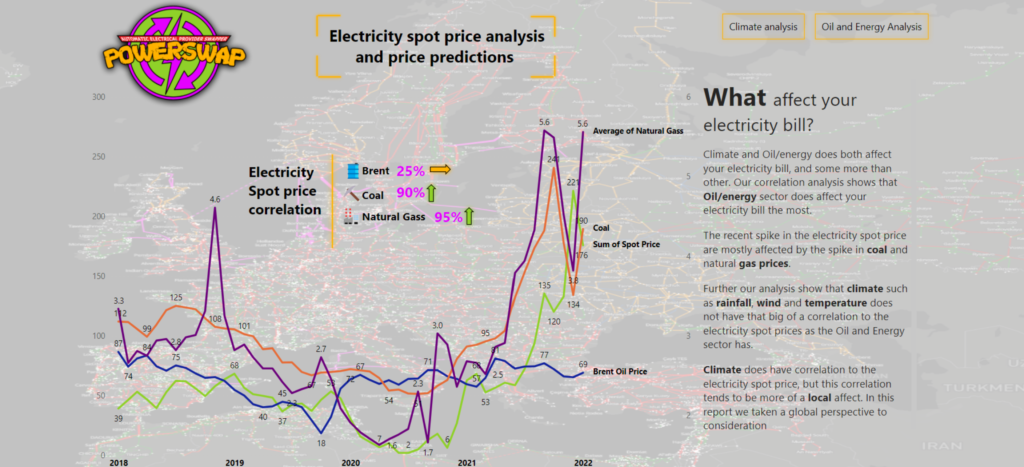
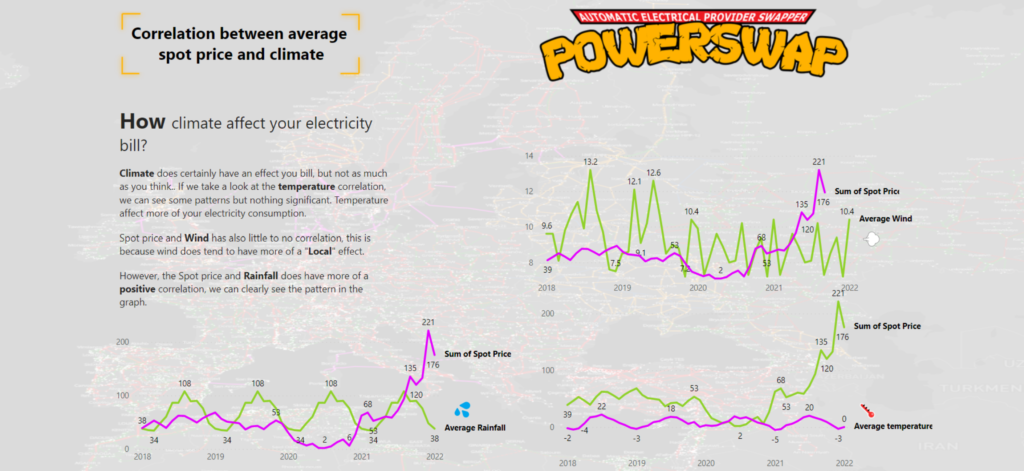
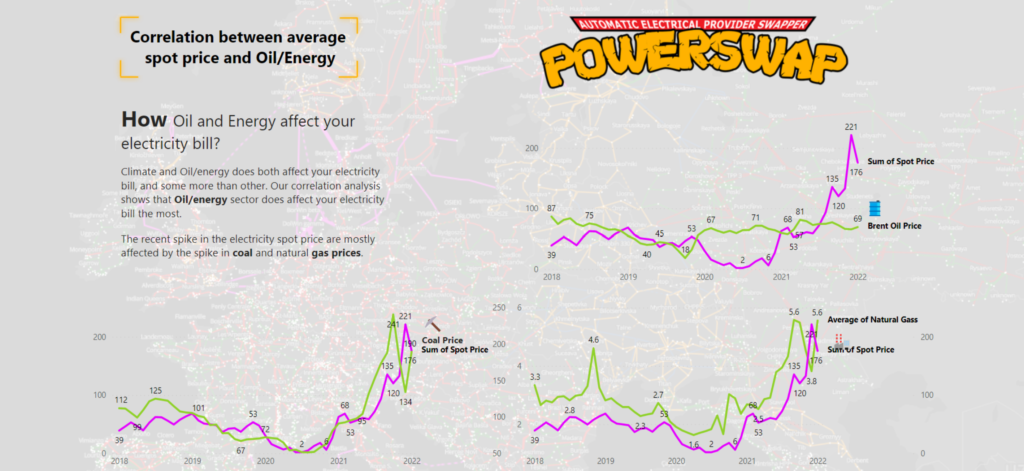
Below we have three pages from our “Power Swap Analysis” dashboard. In these pages, we have collected historic data both from the climate sector and oil/energy to find correlations between the different sectors and the electricity Spot Price.
Excellent User Experience:
These three pages offer a minimalistic design with a sexy look to it, what really is sexier than well-presented data?
Throughout the dashboard we have little to no manual interactions, the graphs are already optimized and well explained with text. We have focused on highlighting the data which is most relevant and outstanding, we believe all this data will educate the people who wonder why/what is the cause of the recent spike in the electricity price.
Most Extreme Business Value:
All though we are not directly an electricity provider we have all the data available because we stand in the middle of all the transactions. By providing this dashboard to our customers we give them yet another reason to become customers and stay customers for a long period of time. This dashboard will educate our customers, and well-educated customers will be long-term customers because of their understanding of how the market implication works.
This dashboard is something we would like to sell to our electricity providers. By selling them this information we can influence them to switch the source they buy the electricity from because in the dashboards we showcase where the correlations are positive and negative.
This will be a win-win situation because if the providers manage to buy electricity from the spot market cheaper, we will also be able to give our customers more providers with cheap and hopefully renewable electricity.
Rock Solid Geeknes:
By collection historical data and making cool graphs will please every geek’s heart. And by collecting this historical data we have also managed to provide even more value to our customers, and at the same time, we have created another income source from the electricity providers. What is better than using geekiness to earn some money?
Killer app:
It is not that common for the electricity providers to share historical market data to the extent of what we have done here. This is clearly the best platform for providing all the data to the customers and electricity providers.
Current data analysis:
Quality assurance of deals
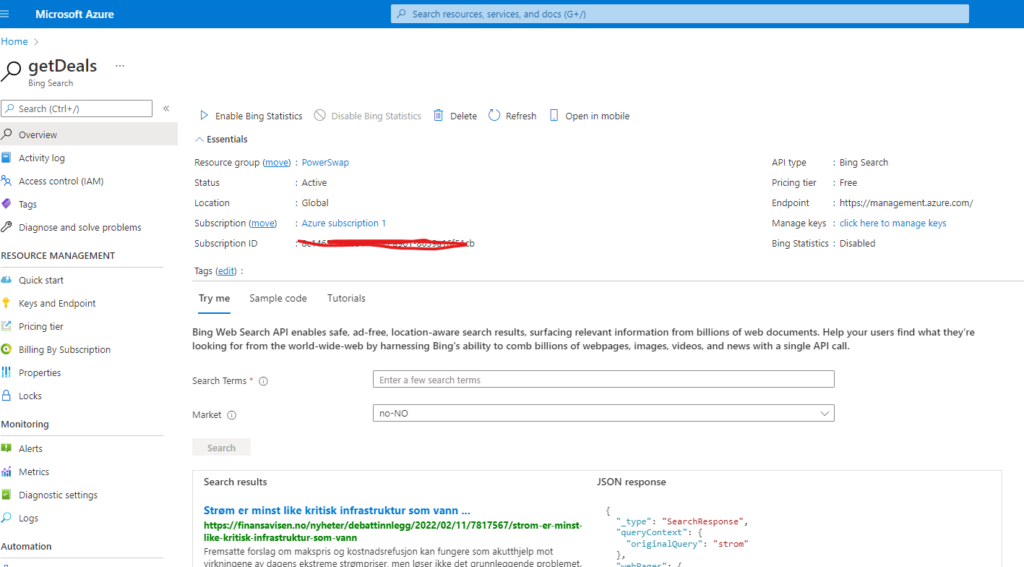
Since we are getting deals from a 3. party provider, we need to ensure that the deals are the best and not least updated. That’s why we have created a crawler that runs scheduled every day to search through search engines with our contract names.
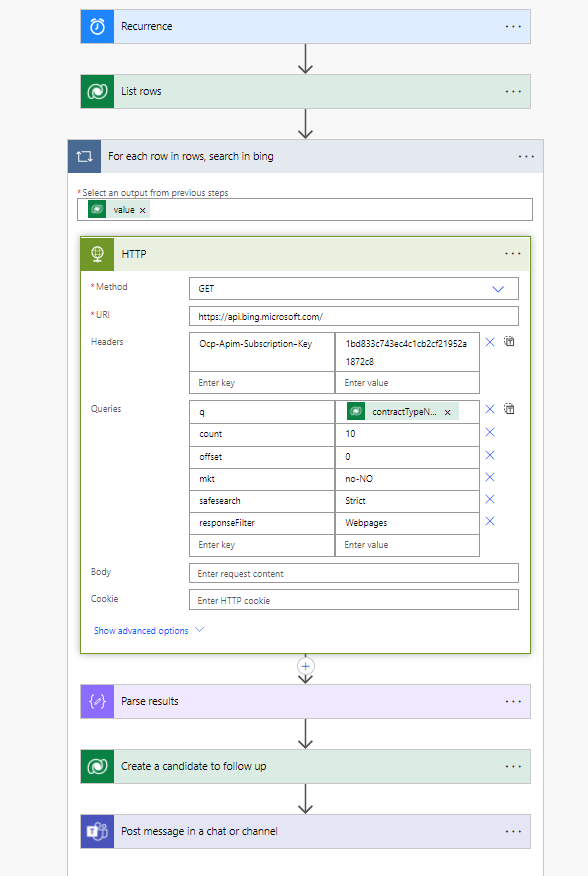
So based on our contract names, we are doing a search on bing each day, to see for possible better deals. We search based on the data we are capturing on www.elskling.no and then use this data to search on bing daily for updates on these contracts.
Rock Solid Geeknes:
Using Web Search API in Azure we could call this API to run search engines with our query as much as we want. We combined this API with a cloud flow. Using data we have already captured earlier (contracts from www.elskling.no) and stored in dataverse, we could run queries through bing with each of these deals.
