FABRIC CATEGORY: Data Activator and Power Automate AI builder Usage

Any person can run power automate flows from dataverse. But only the Fabricator can trigger them from fabric lakehouse data changes using data activator in workspace.

Here we combined the power of fabric with flexibility of power automate to manage our image collection process.

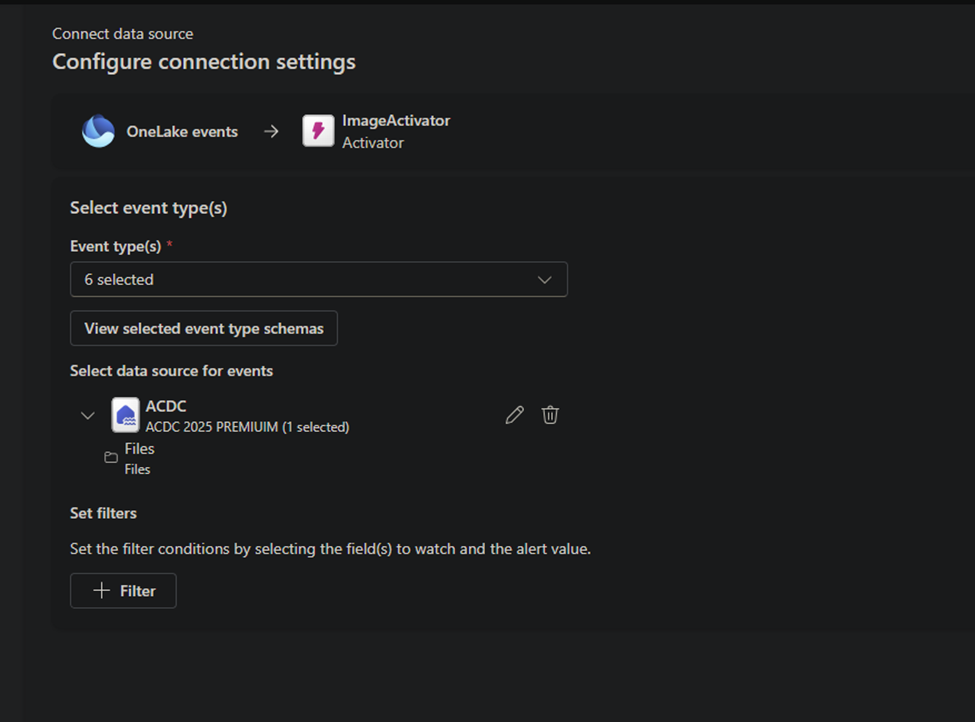
We firstly created data activator and selected our data sources, so activator knows when and where to trigger.

We configured it so it will only trigger when an image file is added to our Images folder for students.
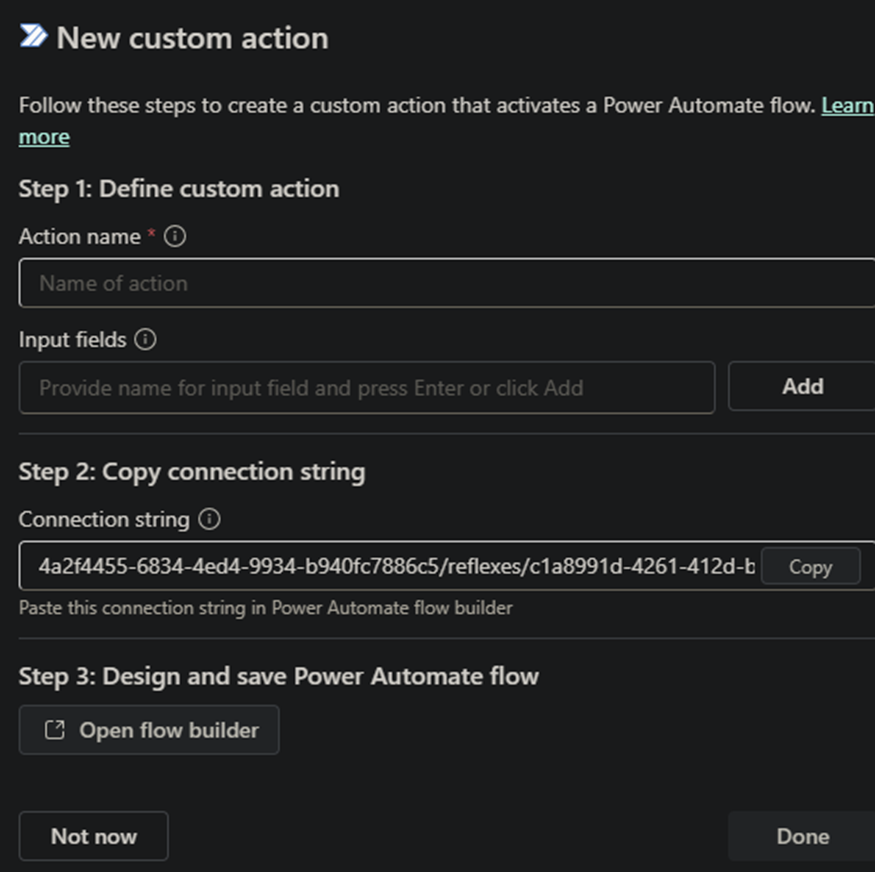
Define action and create flow to run.

Here we define an action and it gives us endpoint to be used as flow trigger. We will come back to here at last step.
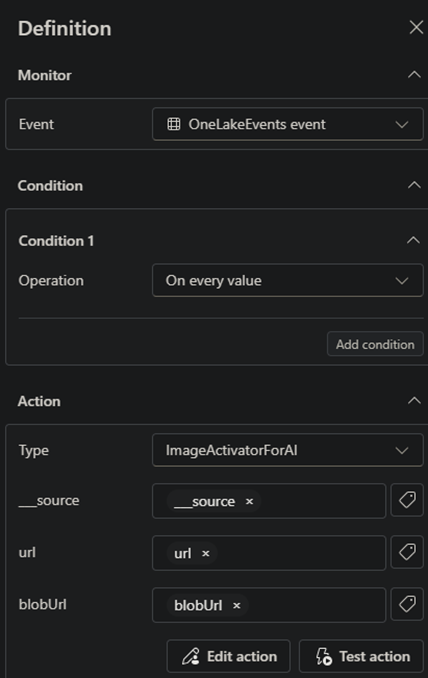
We need to create a rule to call the action we defined. This rule allow us to add additional conditions to our filter if needed, let us choose which action to call. Also we can add additional parameters to be sent to power automate flow.
And lastly our power automate flow: The endpoint we received before needs to be set for connection of trigger.
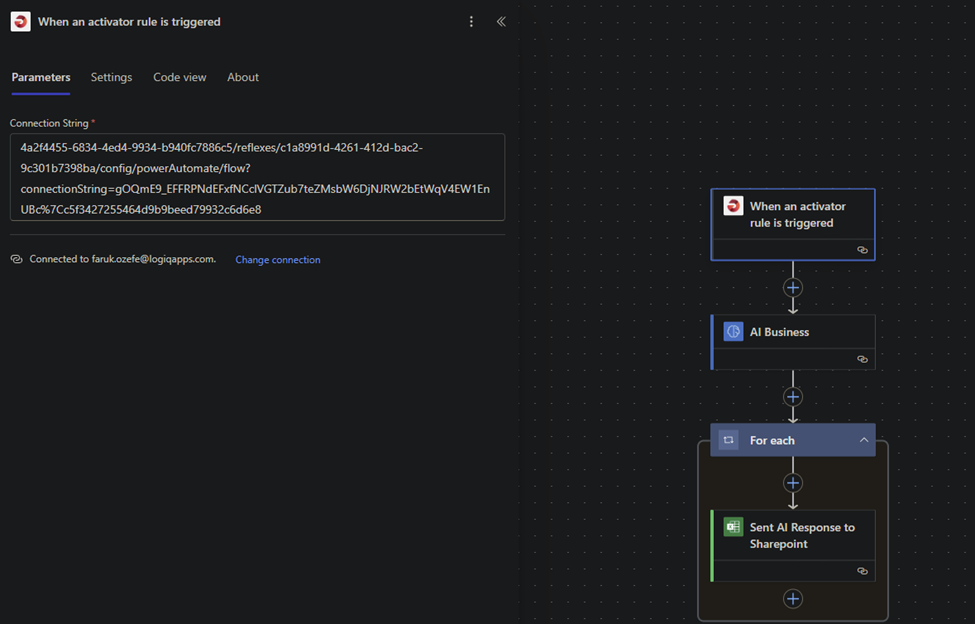
We are using power platforms ai builder to recognize the data and categorize it for further usage.

We send our response to sharepoint for further operations.

As Fabricator it is important to automate our business and keep it tidy and neat. This is the way of the fabricator.

FABRIC BRONZE SILVER GOLD

Can Fabricators do what alchemist cant, Creating gold from bronze and silver? Is this really possible?

After 3 days of work our Faruk The fabricator finally converted bronze data to silver and gold.

Our raw data of 10000s rows split into multiple tables with matching ids and proper relationships.

Convert single table to multiple tables using data pipeline and notebook scripts.

Then inside powerbi we refined this data to be useable for business purposes.

Lets Get our Hands on Fabric Lakehouse (Try and Cry)

We all know that Power BI is a beautiful tool for dashboarding, but it’s always a tricky question of where to get the data from. It needs to be fast, and most importantly, it should be correct.

The traditional way, from what I gather, is using the CDS connector. Here, we get easily visible and editable tables.

Another way, which will also give us Direct Query connection mode, is a connector directly to Dataverse.

But what about Fabric? If we need to create many reports on the same data from the CRM, then it would be perfect to have our data in OneLake, create DataFlow Gen 2 to transform it, and have a shared data model that will be utilized by different reports, dashboards, apps, etc.

For that, there are several ways to do it. The most tempting one is just using a Fabric Premium subscription to create a Lakehouse and using Azure Synapse Link to sync the tables from PowerApps to Fabric.

Unfortunately, when you have a Lab environment, it is not possible to create the OneLake on a Fabric workspace for now. Hopefully, this will be fixed in the future.

Another way is to create a resource group and create Azure storage account in the Azure Portal. If the user has the correct roles and access, then we should, in theory, be able to load tables from Power Apps to this storage and load them into a Storage Blob container. This approach got us much further, and we received a beautiful message on Power Apps.

However, when we try to create a link, the tables get queued but never appear in the Blob Storage.


Another way that we actively tried, inspired by our great colleagues here at Itera Power Potters and It’s EVIDIosa, not Leviosaaaa. It’s quite nicely described by the first one in their blog post here: Fabric And data. | Arctic Cloud Developer Challenge Submissions.

However, for us, this approach did not work as our work tenant was registered in a different region from the Azure workspace where we are developing our CRM system.

Conclusion: If you are thinking of using Fabric, ensure your solution and Fabric are in the same region and don’t use the lab user.

In the end, to have a beautiful, real-time updating report, we will go for the second approach described here: connecting directly to Dataverse and using Direct Query to have a real-time update of the changes.

We also used SharePoint to get images to visualize in the report, and Excel files (xlsx) for some test data.

P.S. Nice article that we got really inspired from 5 ways to get your Dataverse Data into Microsoft Fabric / OneLake – DEV Community

Fabric And data.

A first time for everything. I want to learn new spells and want to try fabric and power BI for the first time.

Testing import data to Power BI desktop – With both data import and Direct Query.

Setting the Data source credentials to get the queried data to the Power Bi Service.

Test is working – Now lets wave the wand and build!

Fabric

HACK:

Got help from a team in the same house – HUFFLEPUFF POWER.

We can not get the trial to work in our tenant that we have for ACDC, so i had to create a service principal user in the ACDC tenant – and make it available multitenant. And then use this service principal in fabric in my work tenant to get the data in there.

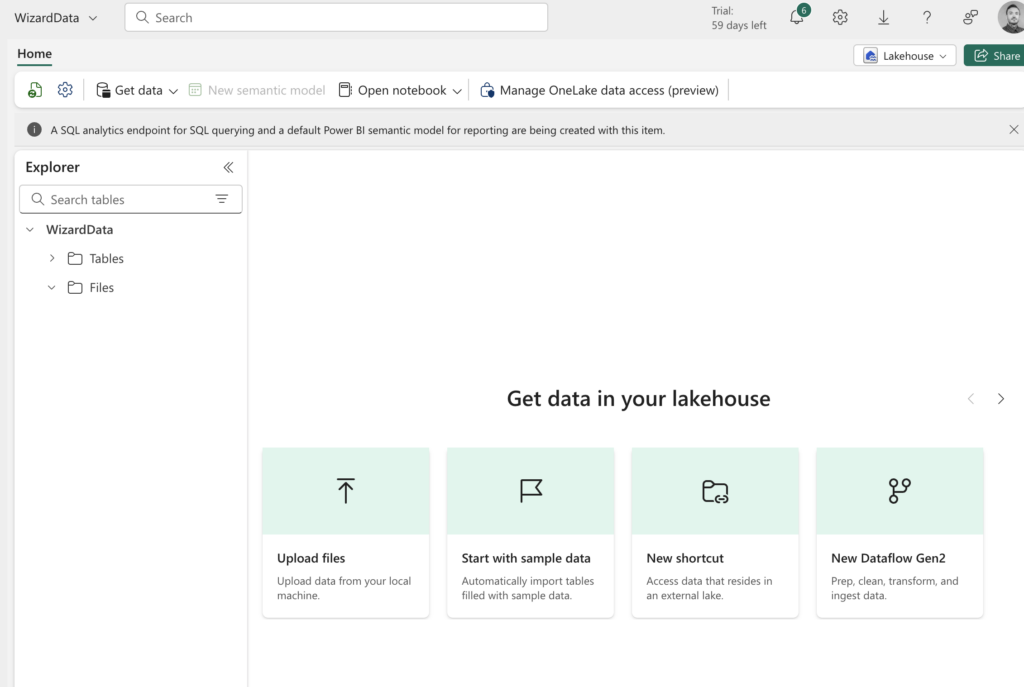
We want to make a lakehouse with fabric, so after the data is clean, we can use it in Power BI and also share the data with other instances that needs to use the data.

Made a new Lakehouse: WizardData

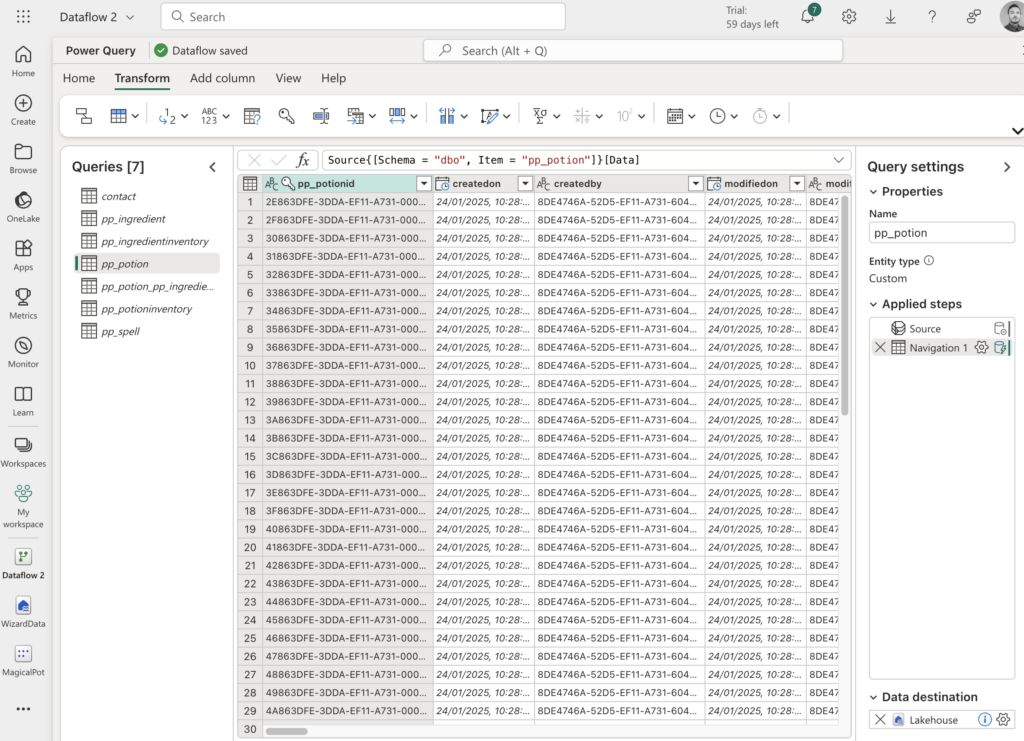
Made the connection to the ACDC tenant

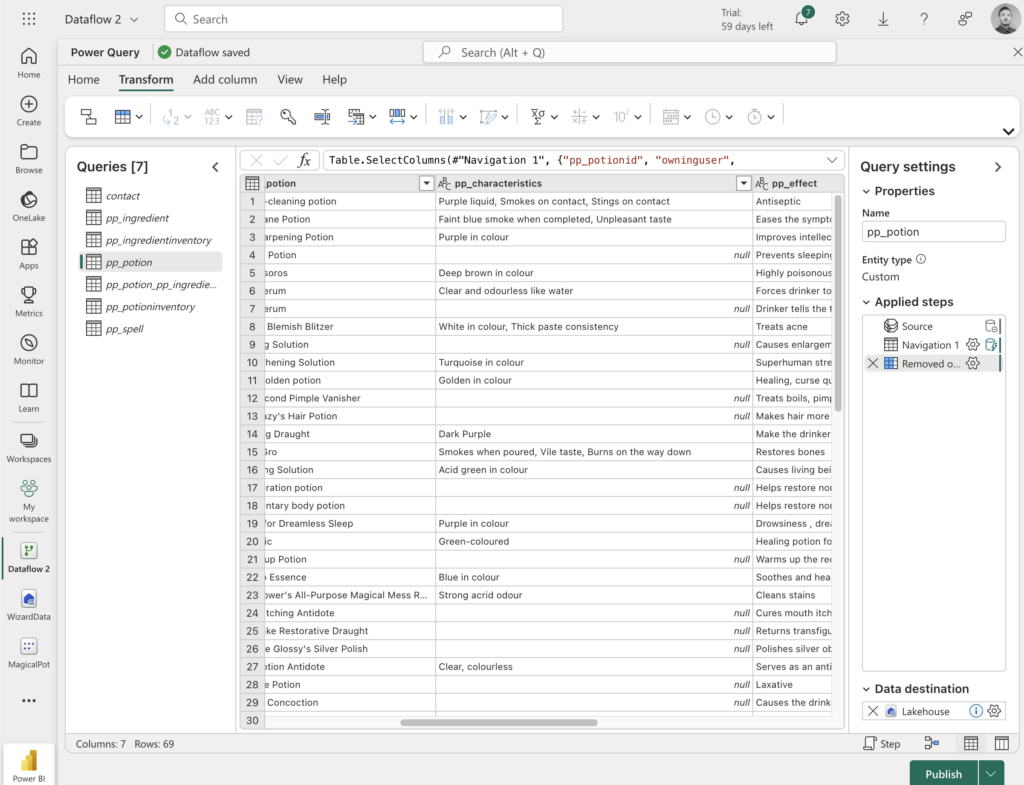
Cleaned the data:

Did this for all 7 tables.

I could not get compliant with the Power BI for my work tenant. So i decided to use Power BI desktop direct query to get the data from Dataverse and build a dashboard.

Start of dashboard: To be continued.

One last comment – We helped another team with the HACK to get the ACDC data into another tenant. COMMUNITY! – SHARING IS CARING!

“The fabric doesn’t call me anything. He grimly does his work, then he sits motionless until it’s time to work again. We could all take a page from his book”

(c) The Fabricator and the Silicon Valley series.

(c) Faruk The Fabricator inspired by the Silicon Valley series.

If you think a student’s story begins when they enroll at Hogwarts, you could not be more wrong.
The Fabricator is evil and does not care about privacy. The Fabricator is guileful and does not care about truth. He will do everything in his power to gather or fabricate every detail of their lives  and use it to achieve his goals.

At the moment,
The Fabricator uses Fabric to access previous data of the students wishing to enroll at Hogwarts.
We call the Kaggle API within notebook code to retrieve data from Kaggle and write it as a CSV file.

Python code in another notebook is then used to transform this data and divide it into clusters.


Finally, a “Copy Data” activity moves the data to its final destination. But is this truly the end?

Follow the Fabricator for more—if you can, that is.

In the coming days, the Fabricator plans to:

  • Show clustered data in Power BI reports.
  • Use insights to plan interventions or recommendations for students.
  • Perform behavioral predictions: Use the clusters as labels for supervised learning models to predict future performance.
  • Trigger emails or alerts for specific clusters needing attention.

Data is born into Fabric, molded by it. Data does not see the light until it is ready to face users. And when it is finally presented, it is blinding.

(c) The Fabricator and The Batman.

PS: with this article we claim the following badges:

Thieving Bastards – we use online data source from kaggle

Dataminer – we are doing data transformation for better reporting and we are using extrernal data.

Go With The Flow – we create the pipeline that can be used to retrive any data from kaggle. We plan to use data activators to send alerts based on the processed data.

Power User Love – in fabric we created pipeline as a low code solution. inside pipeline we are using python code for advanced operations.