Oooh, shiny!

We are fully integrated! In our chop shop we’re creating a motor vehicle testing environment to make sure our applications communicate properly and that the driver is alerted when bananas appear. We don’t want the driver to watch the phone, so we’re removing the alert function from it. Instead, we’re setting up IoT devices to provide the driver with appropriate audiovisual cues. Lo, and behold! The latest patent in the Banana Detection family!

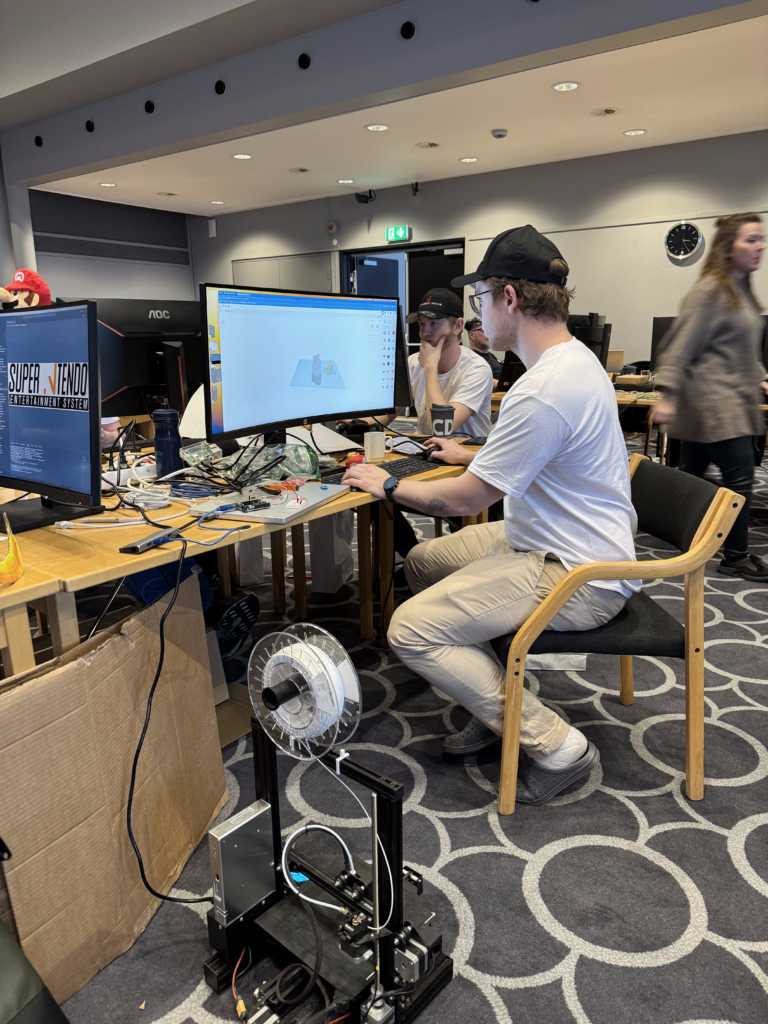
And when you have brought a 3d-printer, you ought to use it, right! We are 3d printing a dashboard that we are integrating a LED light into. The light is attached to a Arduino controller that is governed by a Raspberry Pi. The Raspberry Pi is set up as a server, accepting http requests. When a request is received it alerts the driver that they are approaching bananas through the LED blinking.

Andreas working hard on some 3d-models
Mixed reality – out of the box solution

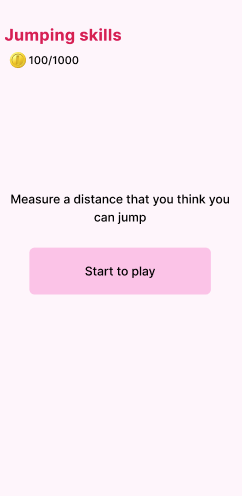
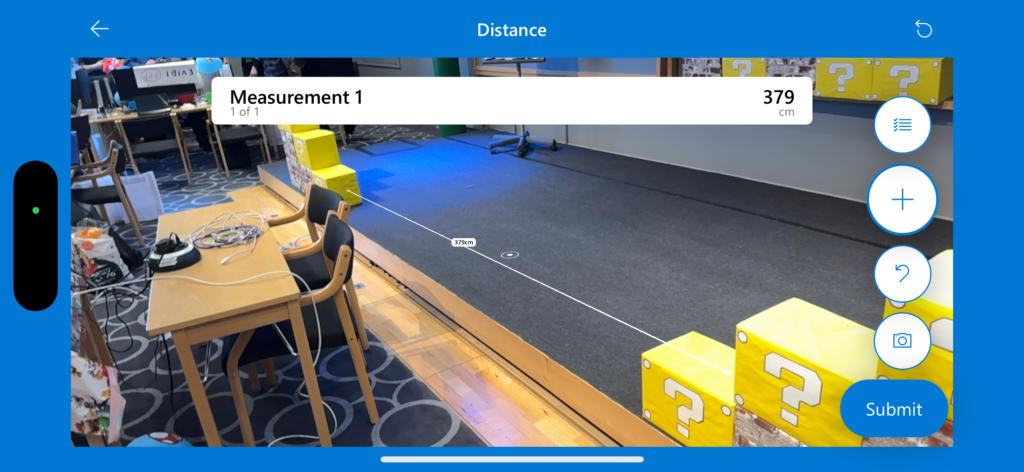
We have incorporated a mixed reality component into the app to help Peach improve her jumping skills. This feature allows her to measure the distance between two objects within the app.

The idea is that Peach should be able to point and measure the distance between two objects she can jump. If the measured distance is shorter than a predetermined threshold, she receives positive feedback generated by AI, along with points that are stored in Dataverse.

To complete the module, Peach needs to successfully perform 10 jump exercises. Her current score or progress is displayed in the top left corner of the screen.

If Peach measures a distance that exceeds her jumping abilities, she will receive feedback from the AI and no points will be awarded.

Example of an Overly Optimistic Measurement:

One could argue that the ability to take a 3D model and view it in a real-life environment to get a sense of its size compared to real-life objects can be beneficial when dealing with unfamiliar objects or sizes. This is particularly useful for objects measured in inches for anyone not from the US.

Embedding numbnut

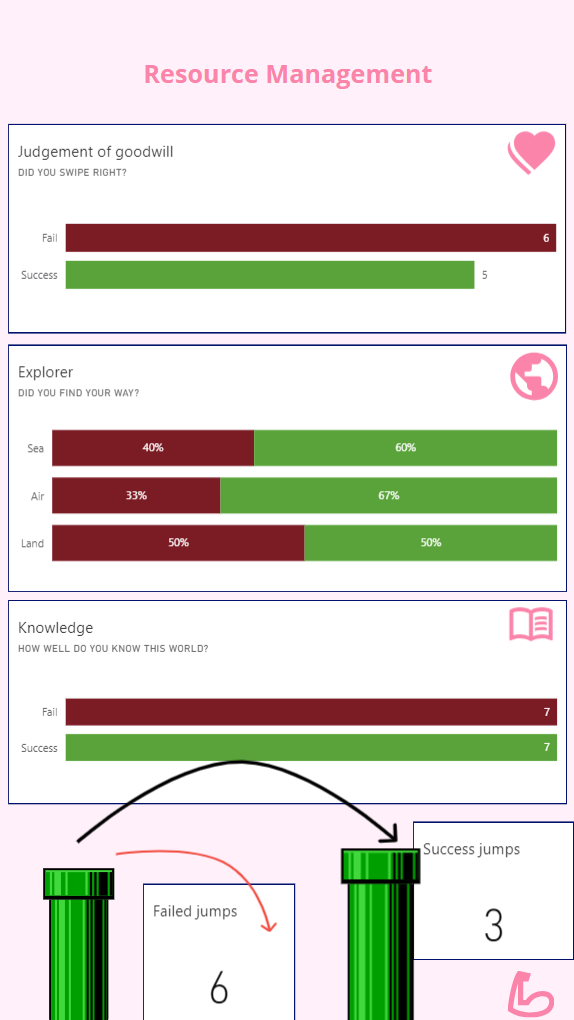
EMPEACHMENT is rich with embedded resources. It features numerous Power BI tiles, each designed to assist Peach in achieving her goal.

Additionally, the app incorporates an embedded bot named Toad, ready to answer Peach’s queries about the Mushroom Kingdom.

More information about the Power BI tiles and the bot is available in an earlier blog post: https://acdc.blog/bouvet24/foour-badges-in-one-poost/

Analog Odometer Visualisation through PCF – Make it rain!

While this is a great visualisation, we must announce that the CSS and JS was not created by us, but by the great Developer VictorNP, which proposed a vanilla JS solution which we transformed into React functional components. As stated by the designer, It is mainly designed to be a read-only component used to display information – Therefore we’ve limited to bounded context fields.

This is an great example of how the limited possibilities of Dashboards in Dynamics directly, can easily be mitigated, as well making the visualisation reusable for different contexts through PCFs, making custom, code-first visuals in our Low-code solution. By harnessing the power of client-side processing, we ensure that our solutions are not burdened by heavy monolith front-ends, guaranteeing a seamless and responsive user experience every time. Of course, memorisation is applied to improve the transitions and performance of the visualisation.

The PCF component on a CRM form

Moreover, the PCFs functions as plugins for Power Apps, which further enriches the user experience through customisation. Our use cases will be mostly related to displaying important business and plumbing related KPI’s to keep track on the current state of our business. Lastly we wanted others to be able to reuse this visual and provide improvements to it, so we Open sourced it and made available on Github! Contributions are very welcome!

UPDATED! The only way is through Teams

UPDATE: we also aim to claim the Hipster badge with this blog post. This is best practices for governance in Teams.

With this blog post we claim Early Delivery Badge

Early Delivery

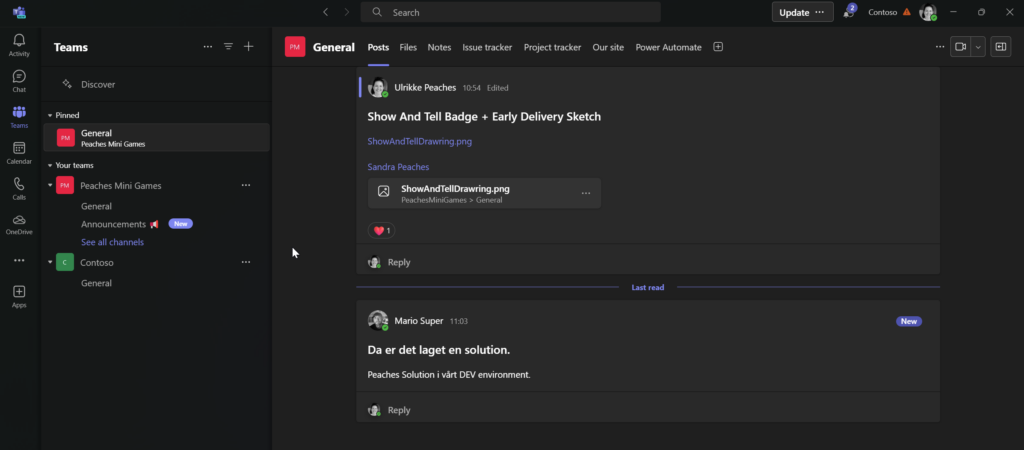
For collaboration throughout the development of the Peaches Mini Games we use Teams, SharePoint and Microsoft 365 suite.

Posts and communication

We post and communicate through the Teams Channel that we created specifically for this development.

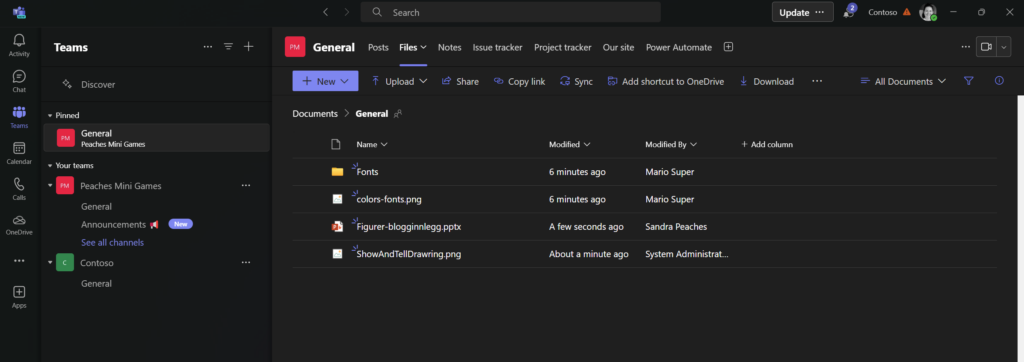
Files

We use the files area (SharePoint Document Library) for file sharing across the team. We have securely stored in one place, always in sync.

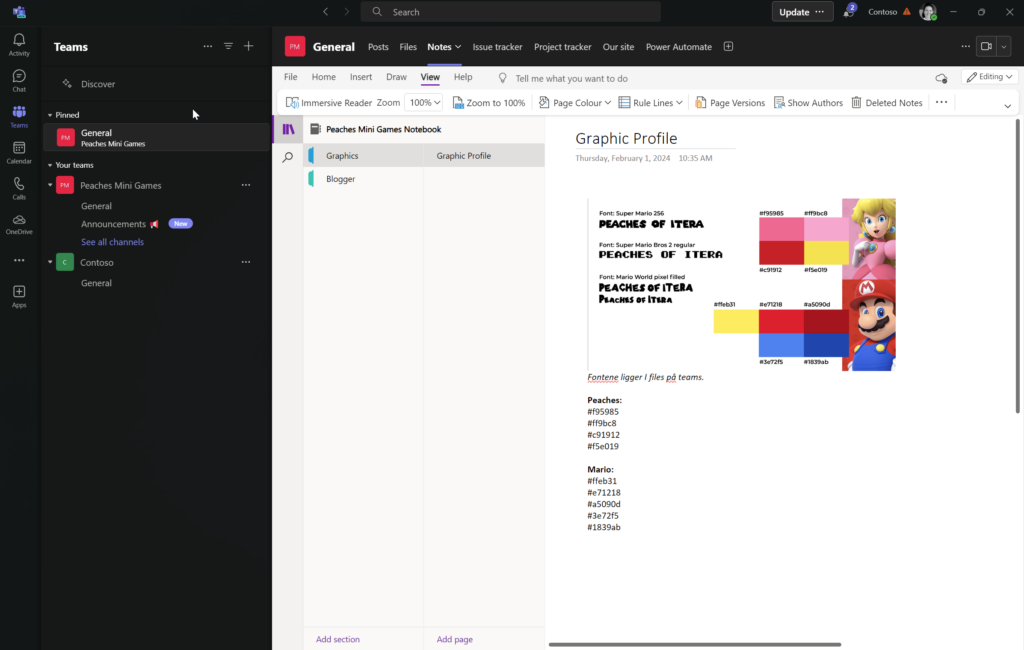
Notes

We keep track of all bigger notes, for example the graphical profile, color codes and other important details in OneNote.

Governance

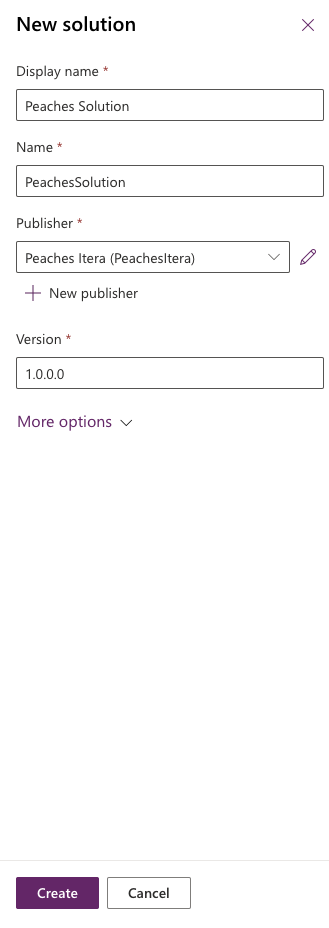
We create a new private Team for Governance.

We are following the guidance from this amazing Youtube video we found:

Creating the Governance Team

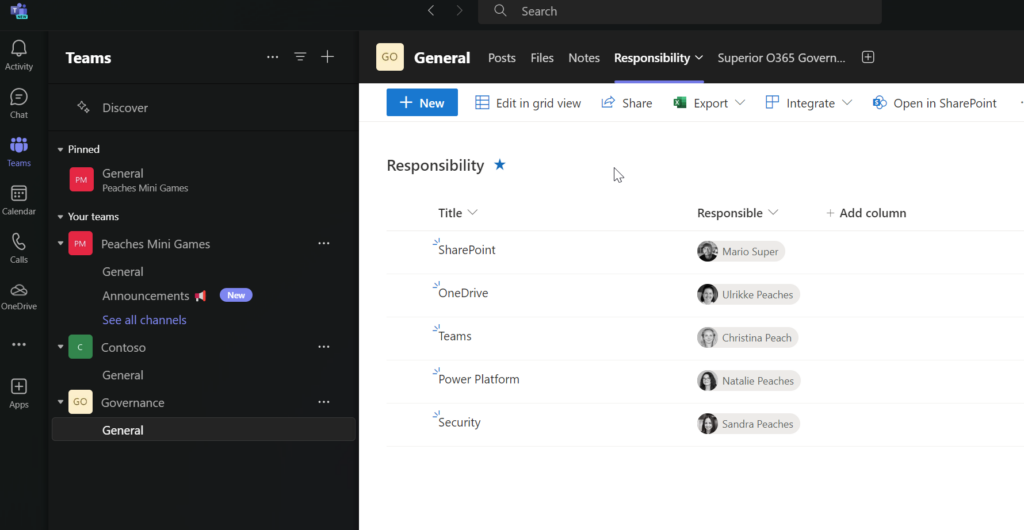
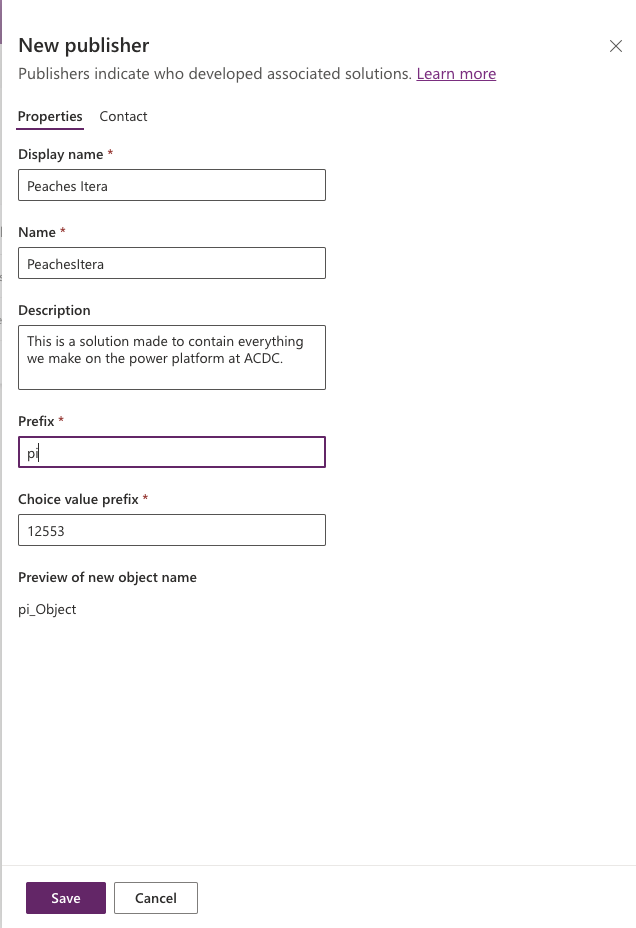
Adding the list for Responsibility and adding the reponsible people:

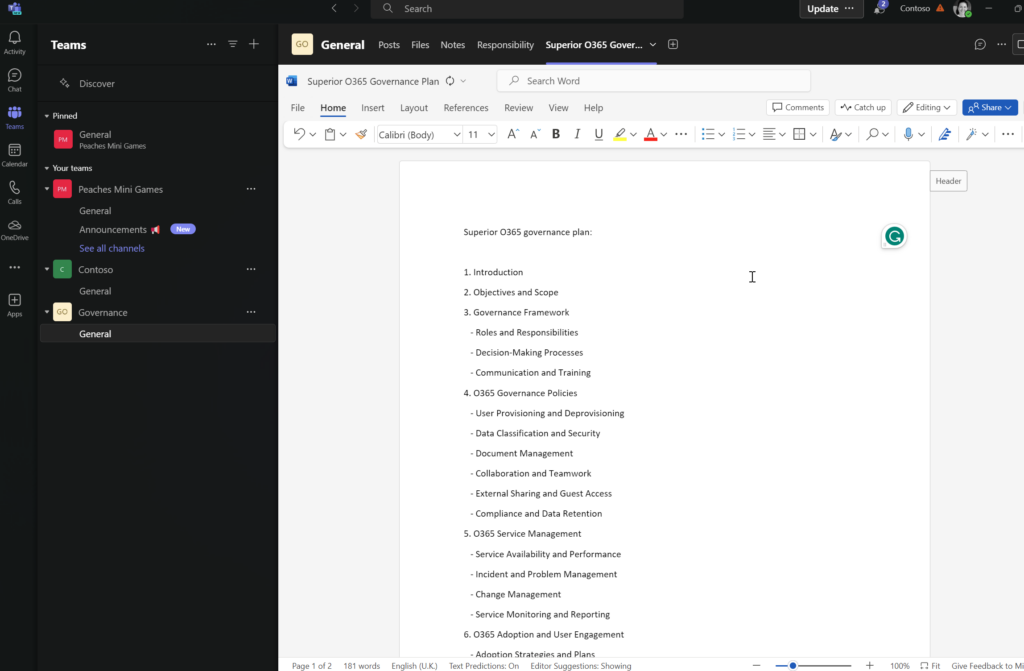
Superior O365 Governance Plan document:

Free UI

Sharing is caring, to the teams without a designer, here are some free UI elements to help you get started!

We recommend using Figma: https://www.figma.com/downloads/ (free design software), and to help you get started we collected some main components for iOS, Android and Web (fluent), and of course the Super Mario colors!

If you need any additional help, ask Sofie!

Link to GitHub where the figmafile is

All in one AI package

Badges:
In this article we want to claim feature bombing badge.

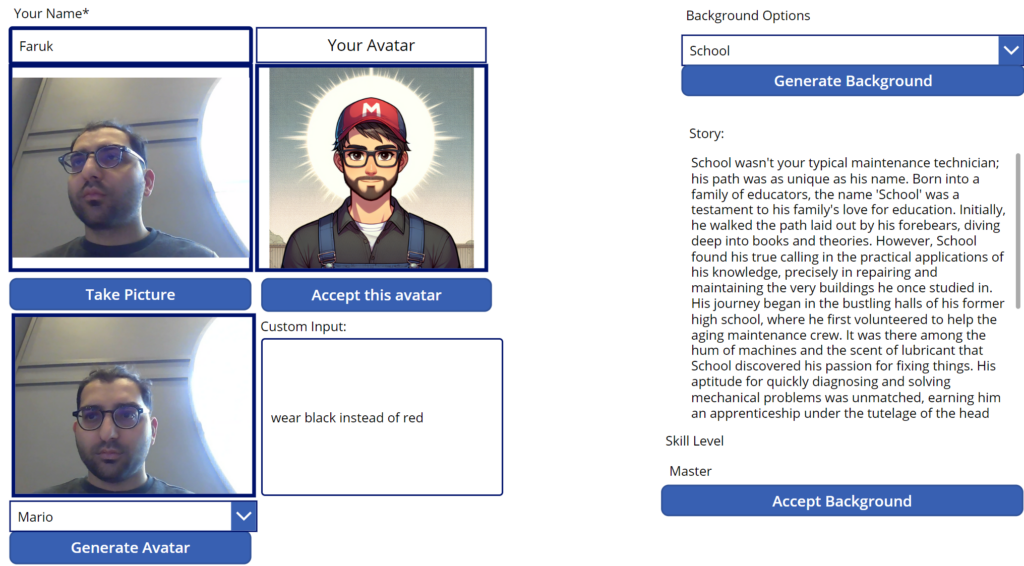
This is version 0 of our mario onboarding app. Here we have following features;

  1. Picture saving
  2. Choosing a character to generate an avatar
  3. Generating avatar
  4. Adding custom prompt for AI generation
  5. Generating background story
  6. Defining skill level by using sentimental analysis
  7. Each AI generated output is saved to the database at every step.

Double dash it out!

Literaly, double dash it out. We ❤️ power apps, and want to show you our latest innovation by claiming both Dash it Out and Power User Love.

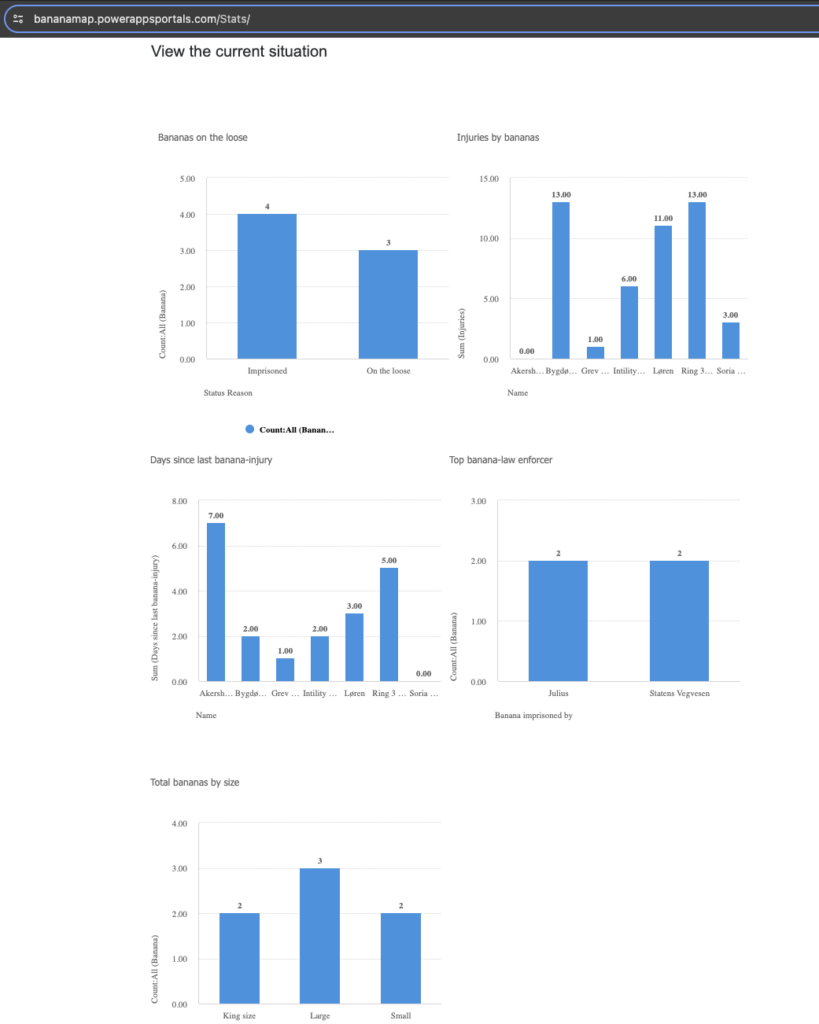
First off we have created a dashboard with banana-related statistics. We used power pages with the super fun liquid code template language to create a total overview of stats in our admin Banana Portal™ (Hopefully Donkey Kong won’t find the url):

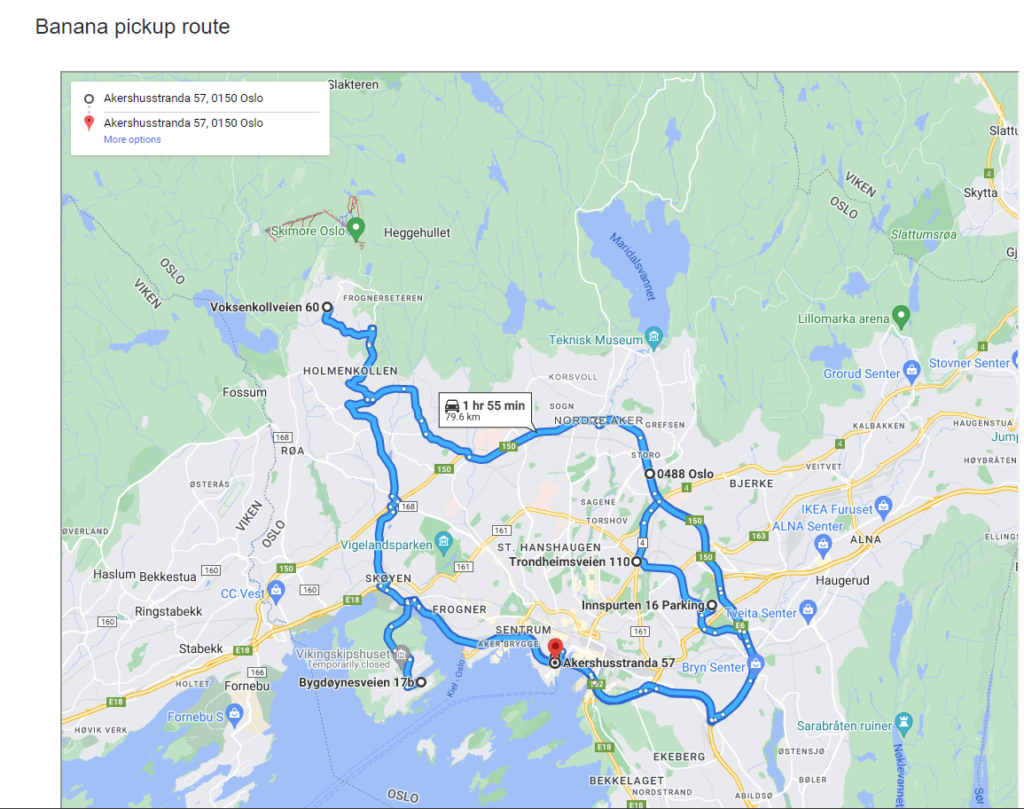
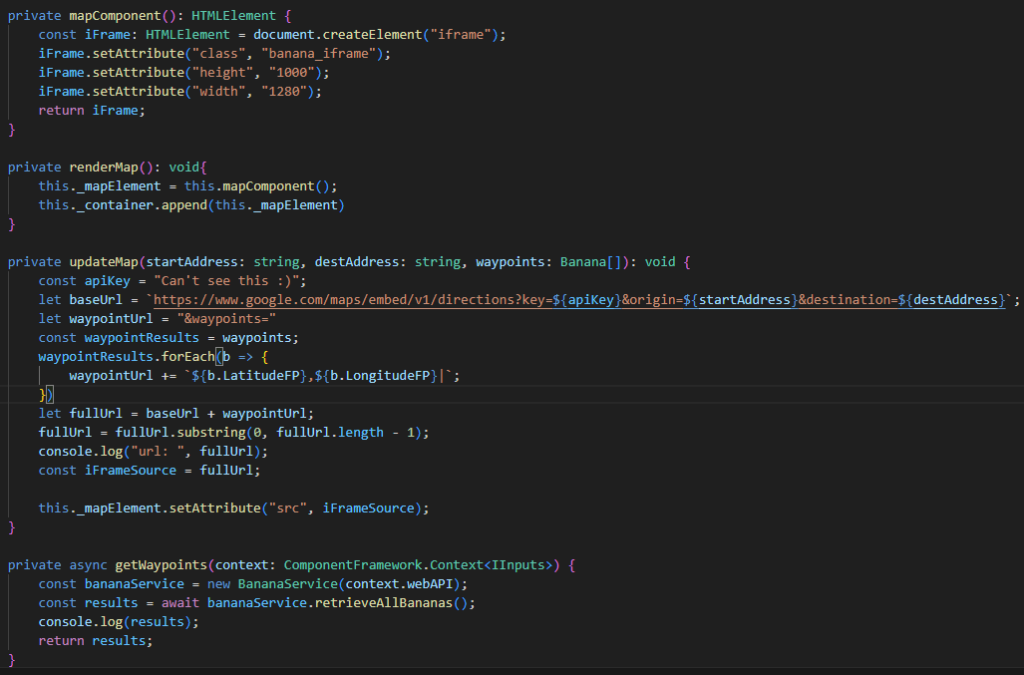
The Banana Portal™ also includes a banana pickup route planner for the Norwegian Road Authority. Every detected banana is registered in Dataverse, added as a waypoint, and voila! An optimised route is calculated. Combining power pages (low code) and typescript:

Edit: added photos of the actual power page.