Awesome title regarding PowerShredders of Axdatas work so far

We’ve now been sitting here for, well, let’s just say, for some time, and this is what we’ve done so far (and a little reminder of what we want to end up with) within the different categories (nice and orgenized for your pleasure):

Excelent user experience:

As our total solution is planned to make the Onboarding process a lot easier, streamlined and reduce the possibility of errors down to a minimum for companies, and at the same time make it a lot more exciting for new employees in the time between the signing of the agremment and the first day of work in the new job, this will not only be excelent user experience from the tech side but also from the personal side in the process!

So far in this hackaton, we have made it easier for both the HR department and the IT department to make everything ready for the new employee coming in. Now the two departments doesn’t even have to talk to each other to create a Azure AD user for the new employee, give the licences the employee needs and give the user acces to the systems it needs. Our Power Automate handles all of this! And, it even connects the AAD user to the correct worker in Dynamics and assigns it the Employee security role!

But, before the new employee even starts, why should it be difficult to send an Employemnt Agreement? Shouldn’t HR be able to do that from the same HR system they use evfery day? We say yes, and that’s why we’ve today integrated Dynamics 365 HR with OneFLow, so that you can send an Employement Argeement directly from D365 HR to the new employee, ready for signing, with information about the candidate entered into D365 HR! We are now creating the app for this, and the app will be embedded in the HR system. And, just to be very GDPR friendly, we do not ask the new employee for the National ID number in an email or something, the Employee writes this directly in the contract to sign, so that we can pick it up and automatically enter that information to D365 HR as well, without anyone needing to see it (work in progress, see also earlier post tagged with Right Now):

Most extreme business value

It almost sounds too cocky, but how is this solution not an extreme business value? It takes away a lot of manual work done today, and it is also a lot more GDPR friendly as sensitive information don’t need to be sent around by email. Tomorrow, we will also create a PowerApps Portal, where the new employee will get a lot of information about the company before it starts, and this is also the place where the new employee will fill out a lot of information about himself, and this information will automatically be imported to Datavers and to D365 HR, without anyone needing to see the information on the way!
But, for now, we have the Power Automate that at least gives all current employees the notifications they shoukld recieve reguarding the tasks they need to perform in the process. This makes sure that nothing is forgotten, and the new employee will haver an amazing onboarding and start in the company:

Rock solid Geekness

With every technoligy and tools that we are using here, we use it to make the workday and the world a better place for botjh HR department, IT department and the new employee that is starting! If that’s not the best use of tools and technology, then what is??

Killer app

Our total solution consists of so many different parts, and they will all work together beautifully! It’s amazing to see how much functionality you can combine in a solution, and have it ready to import to many different customers. With a little personalizations here and there, this solution can be used by any company in the world that uses Dynamics FO or Dynamics HR.

Lets summerize what we have done so far from day 2

Things starting to look good here. Here is what we have done so far:
1. Excellent User Experience

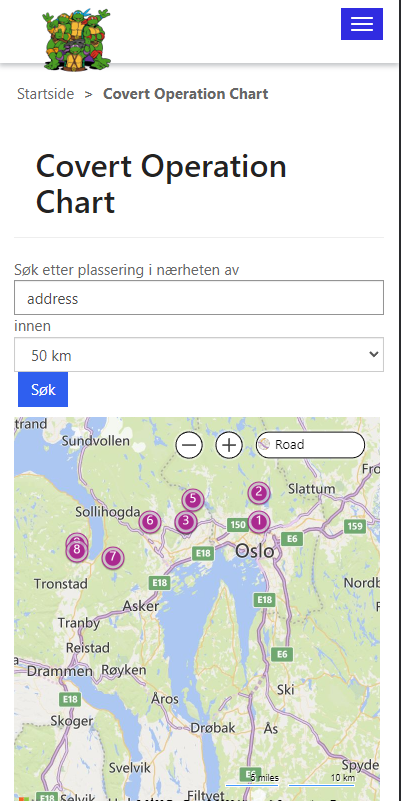
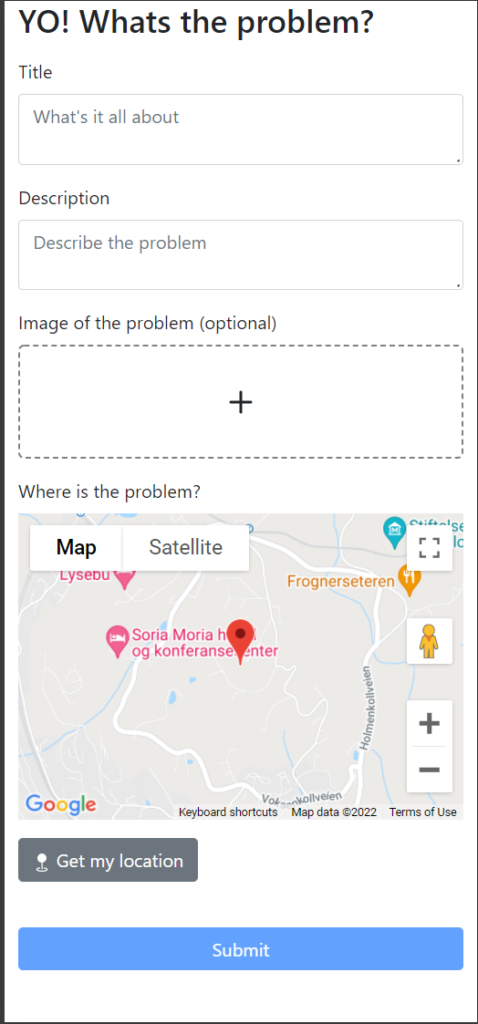
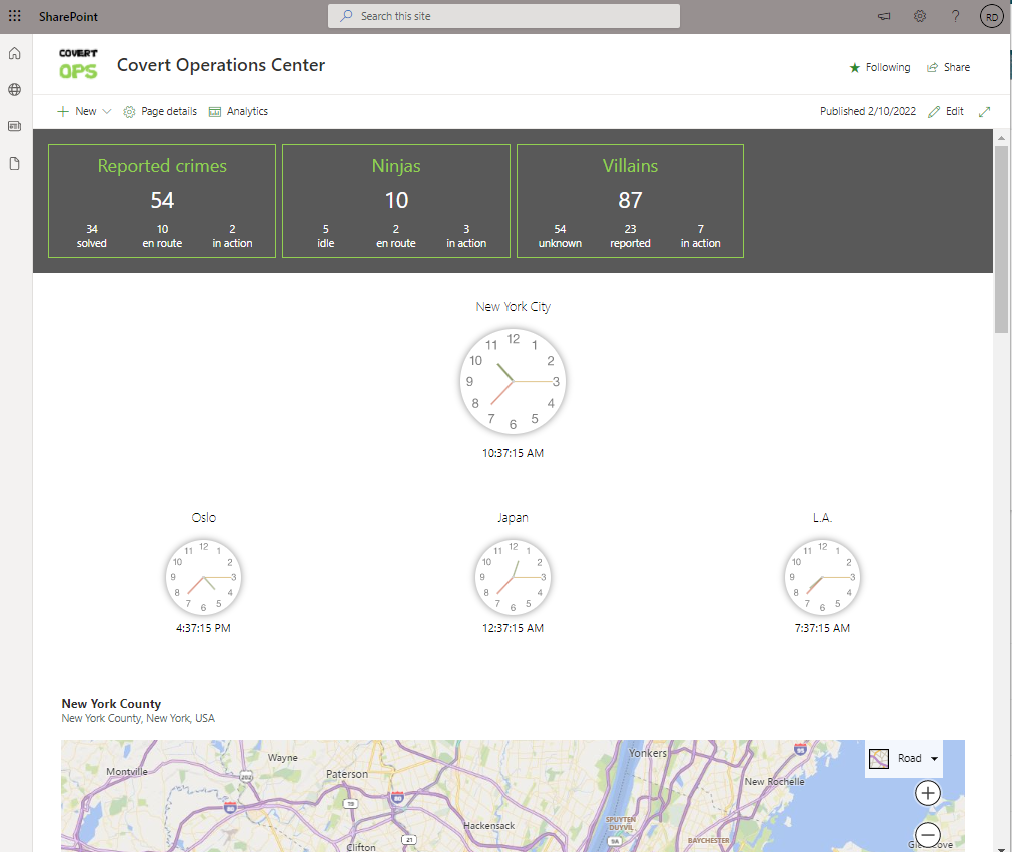
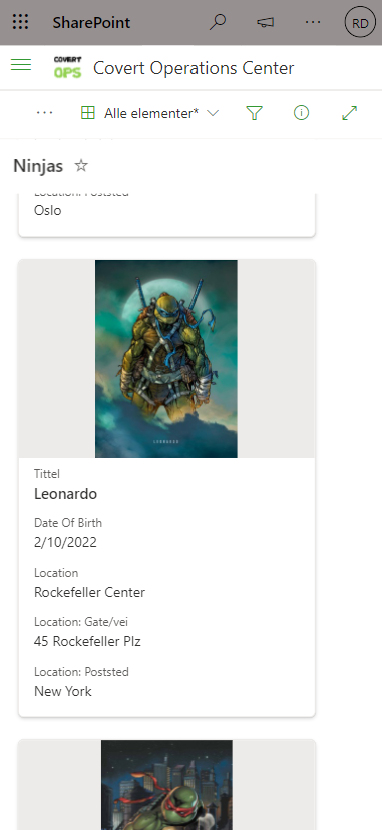
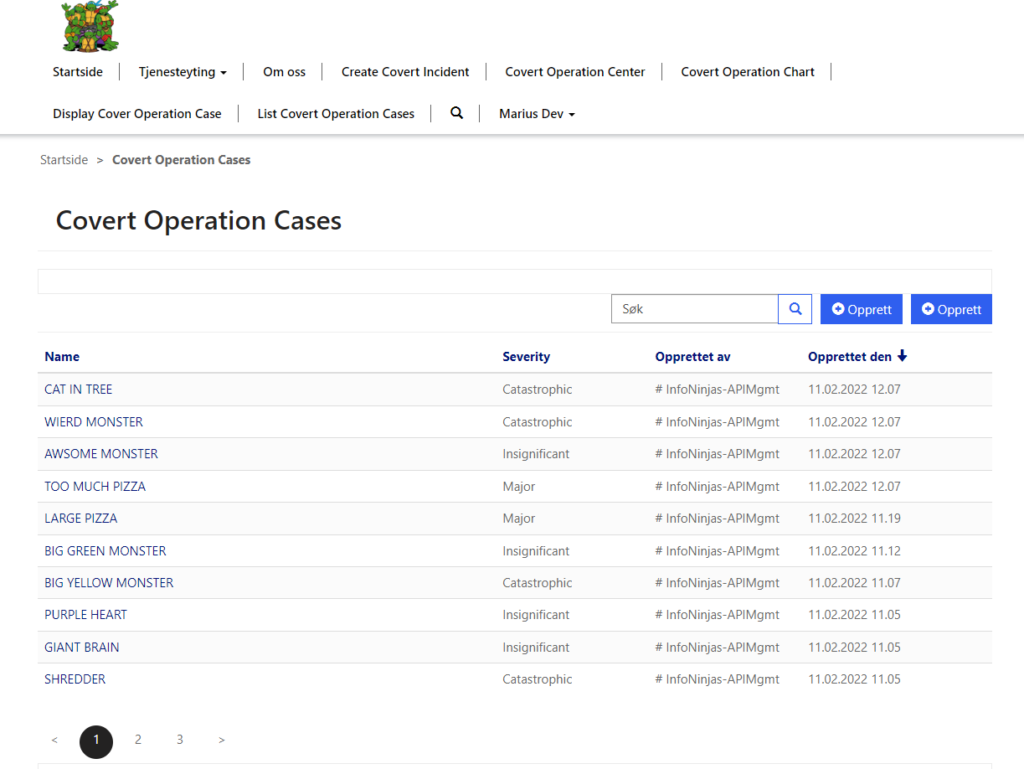
The citizens can report incidents using the PWA(React App), Teams app and by e-mail, making it easy for the citizens to report using their preferred way. Splinter which is the head of TMNT has access to the Covert Operation Center where he easily can monitor new incidents and assign them to one or the whole team of TMNT.

For Citizens
– So the users can submit cases from email address and it will go to the React PWA. This process is automated (Power Automate)

Quality Management Portal where TMNT can improve and monitor performance. It would be possible to start the quality process right from this solution.

image

2. Most Extreme Business Value

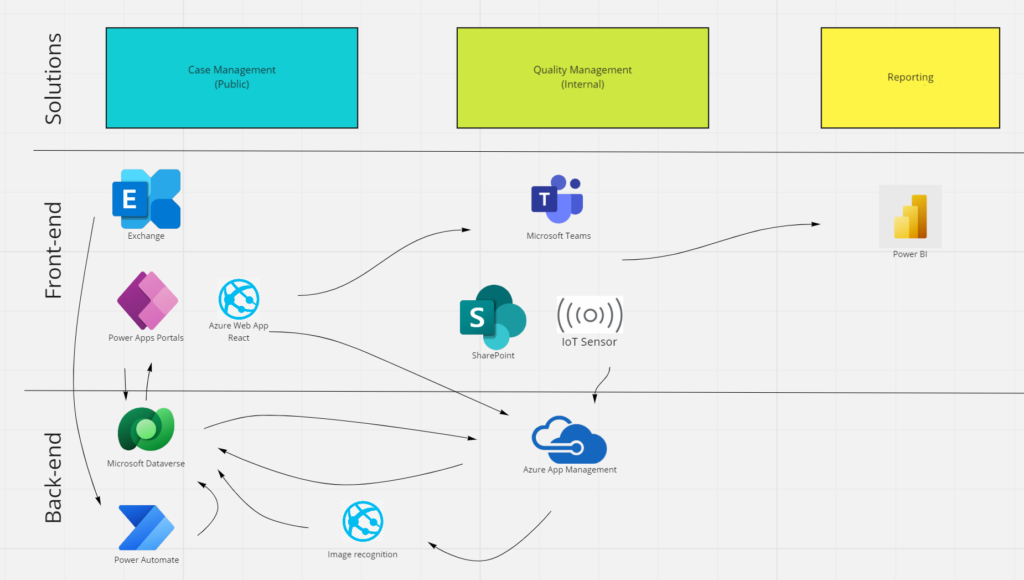
This is how the solution is built, It supports many cases and different inputs that the TNMT can manage all the incidents happening around town. As you see the technologies are connected together to provide awesomeness!

3. Rock Solid Geeknes

With the use of image recognition, we automate the process of setting the severity of each case. This way Splinter can prioritize easily which incidents that need focus.

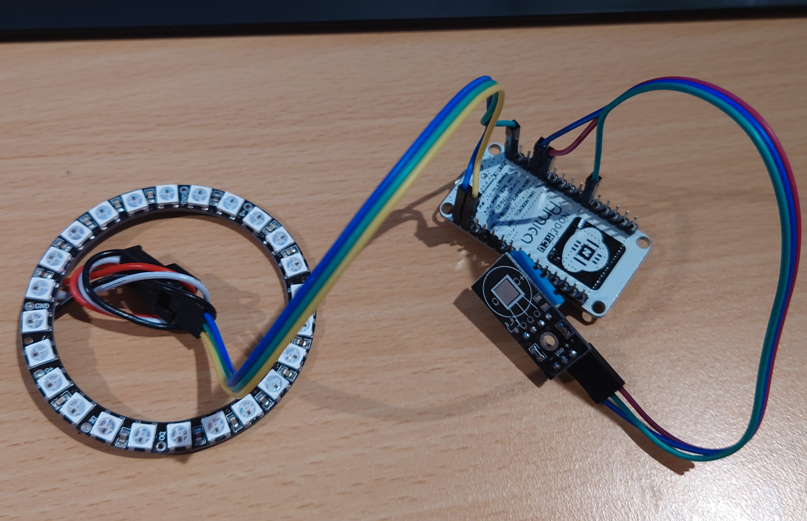
TMNT have placed a set of IOT devices that report anger levels around town. This may also give a pulsating light that soothes the angry people and make them sing.

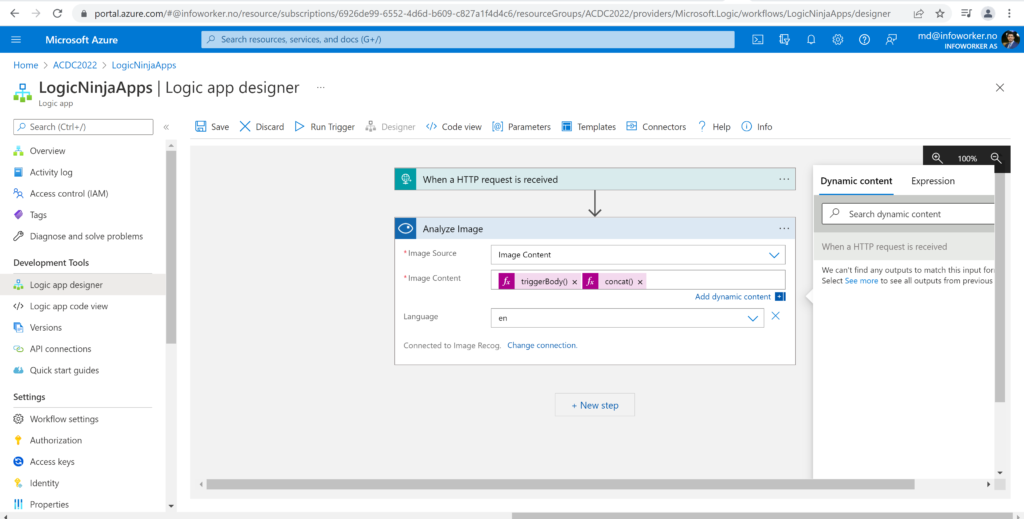
Logic app that post data to Image Analytics.

4. Killer App

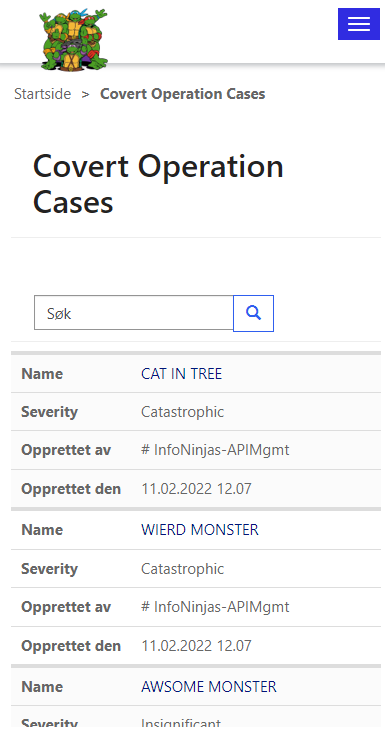
The awesome Covert Operation Portal is also a PWA, Splinter can easily assign incidents on the go and get notifications when new incidents are reported.

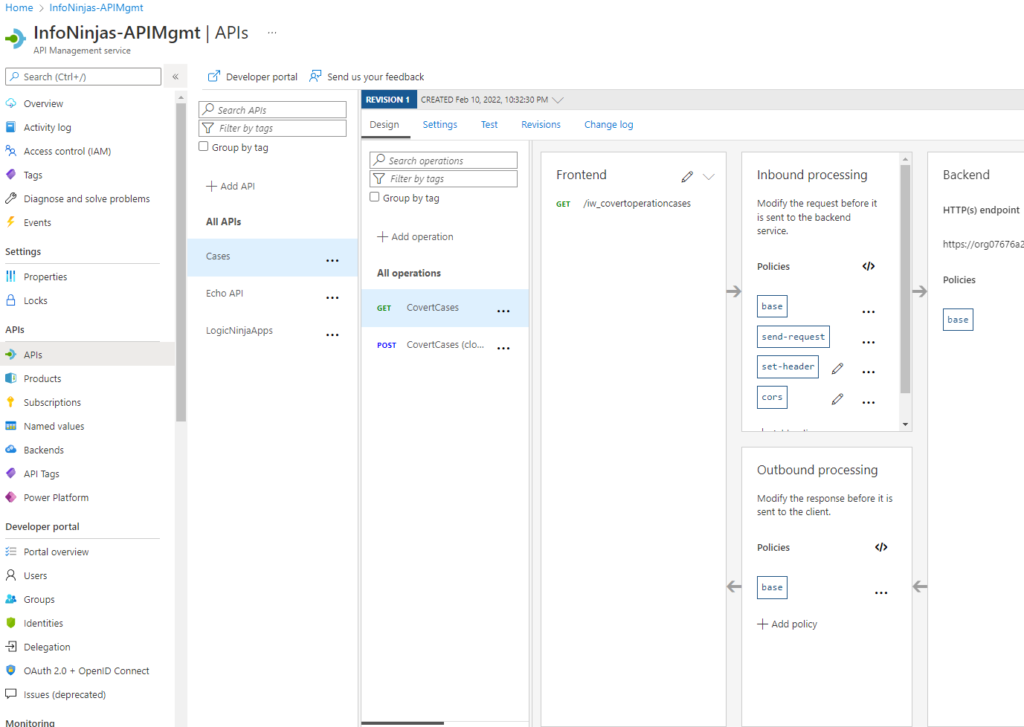
Security is of uttermost importance therefore incidents submitted using the React PWA is ,submitted to an API Management endpoint. This limits any exposed API’s and gives good control over what data we are exposing.

Pizza Time Friday Update

WOW what a day it has been. We have all been busy at work with our the ordering and delivering concepts.

Poja:

Working hard on the Canvas App to make sure that the backend matches the amazing visuals we have worked so hard on (frontend).

No images available from tables in Dataverse, but the data is there😂

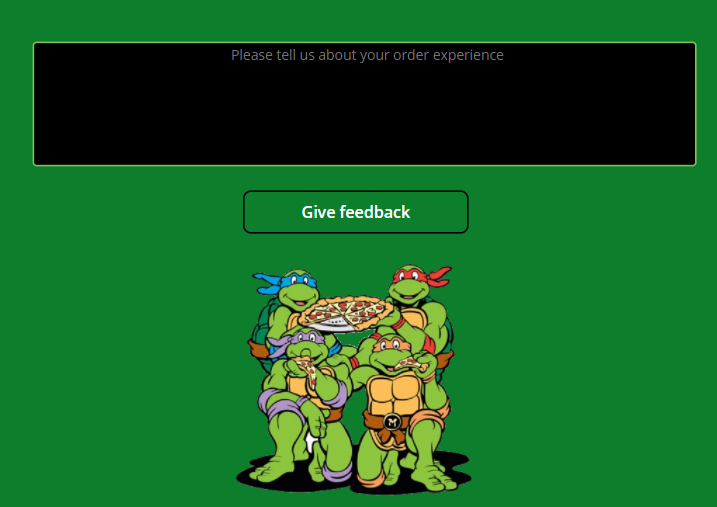
We decided to extend the ordering app to include feedback forms. We felt it was important to understand our customers better. With a custom connector to Azure Cognitive services we were able to get sentiment analysis from the users feedback.

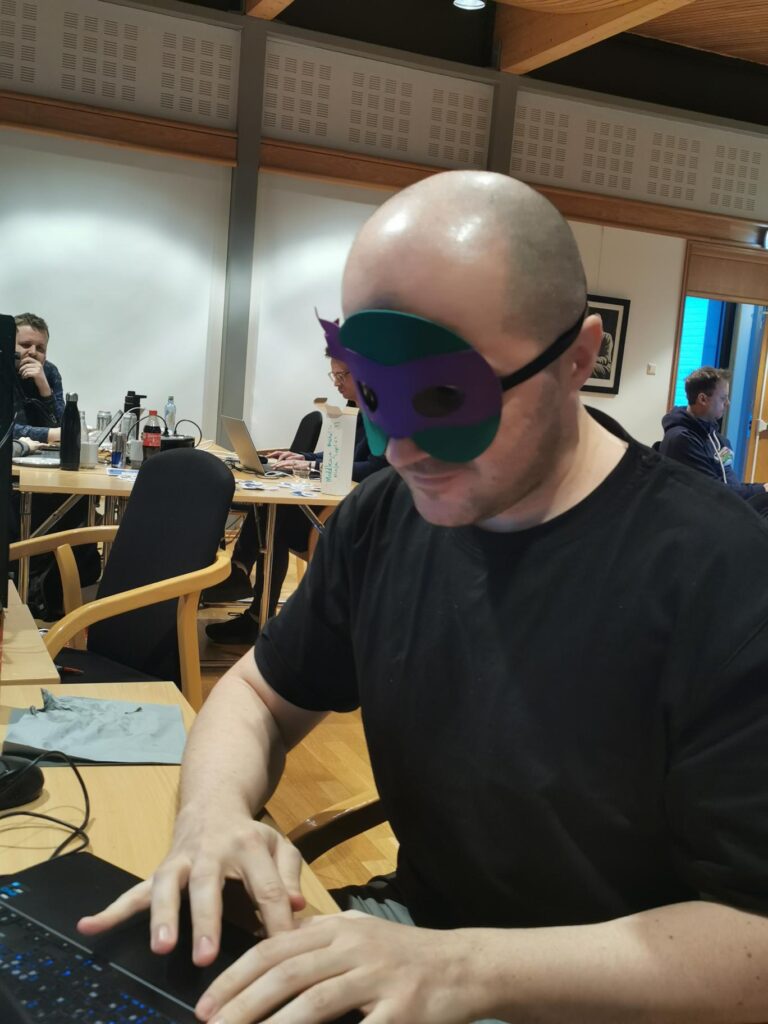
He is also working on a discount system for all of the “Masked Members”. For every person with a turtles mask, we want to offer a discounted pizza!

Mikael

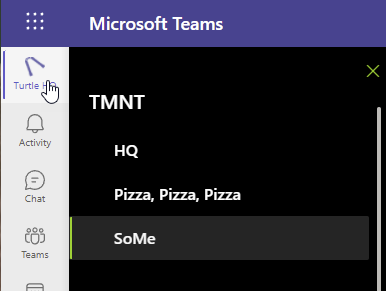
Even though the turtles are BAD ASS and they totally KICK ASS, they also need to stay organized. We have been working on the Teams/SharePoint tools they use internally for organizing the entire operation. Without collaboration in their every day activities, it would be hard to stay on top of it all:) The idea is that regardless of the tool they are in, ordering pizza and being up to date is a few clicks away.

SharePoint Home Site in Teams – Global Navigation to Pizza Ordering etc.

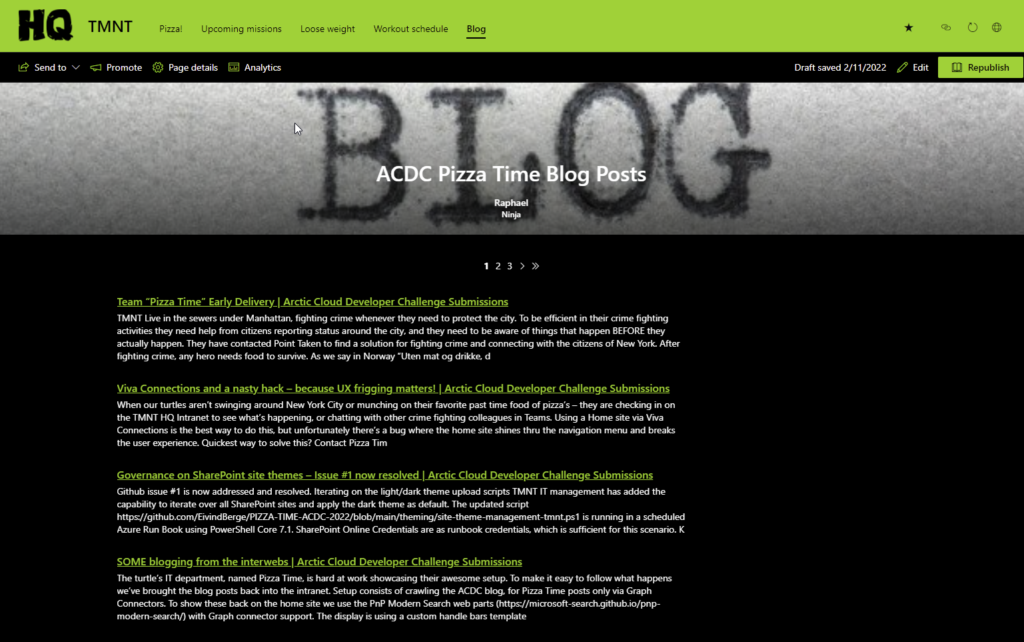
They also have a crawling engine going for all of the dark blogs out there. This way they can try to pick up bad guys before issues arise. This way we can better work with preventative crime fighting.

Blog roll

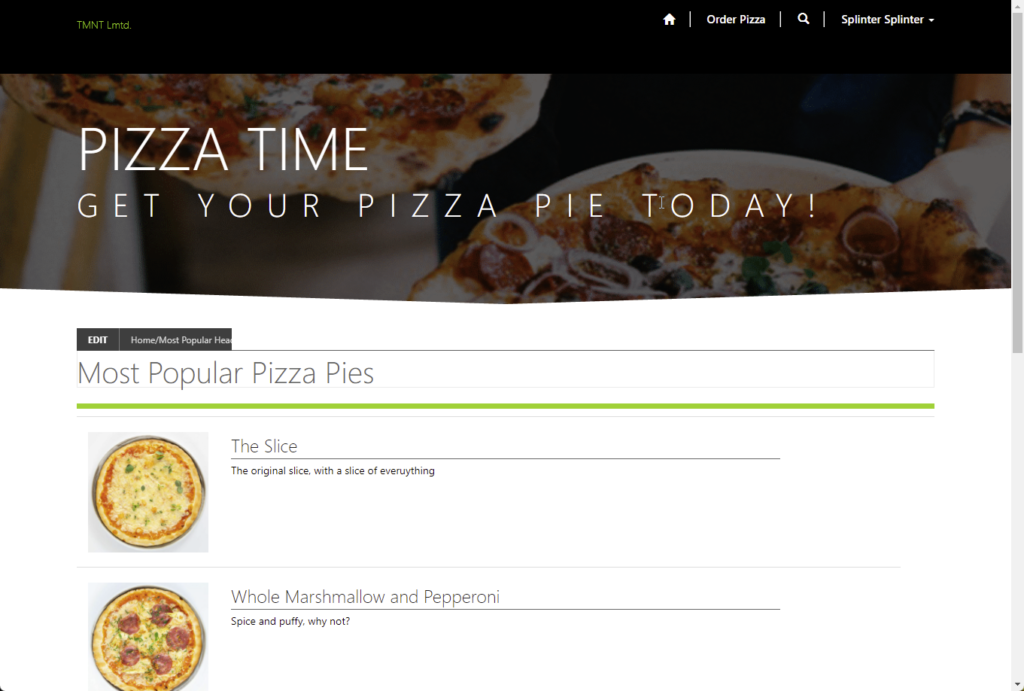
Turtles are of course not the only ones in need of pizza. Head over to the Pizza Time place and get your pie today!

PowerApps Portals

Thomas

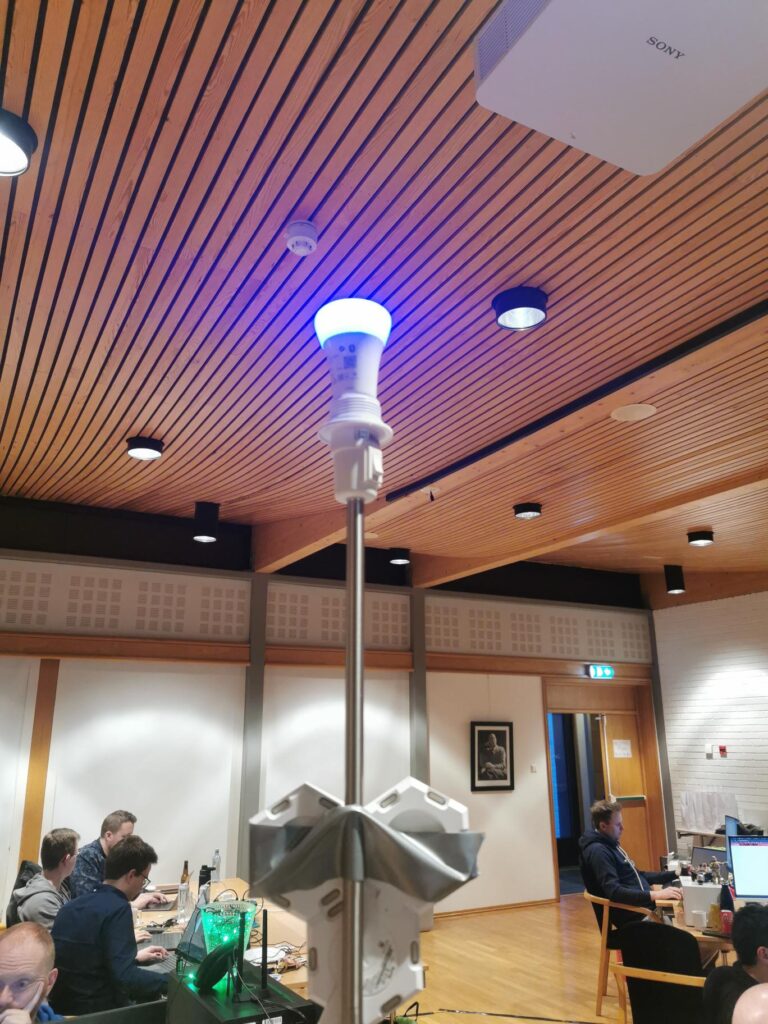
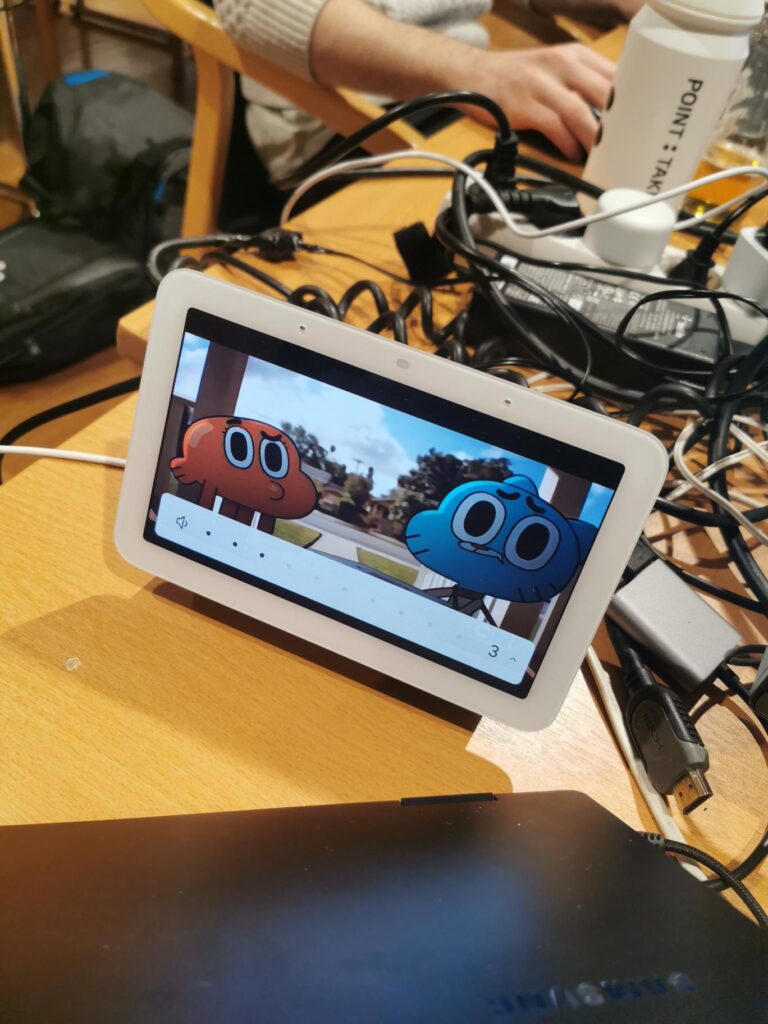
Working on the delivery elements of the pizza order. When a new order arrives in Dataverse, we trigger a Power Automate Cloud Flow. The cloud evaluates the delivery status, and then triggers a Power Automate Desktop Flow that triggers the Head Quarters status Beacon. The purpose of the beacon is showcasing the status updates for the customers. We build a flow that triggers a light and the google nest (youtube video on screen).

Light is dynamic, but hard to show in a picture.. come by our table for a demo!
Video of pizza is really cute, but hard to show in a picture.. come by our table for a demo!

Next phase is including the delivery status with notification of completed delivery with a light displaying the correct color for delivery status. Pizza warm = Green, Pizza cold = red. Might seem counter intuitive, but the green / read is successful yes or no 🙂

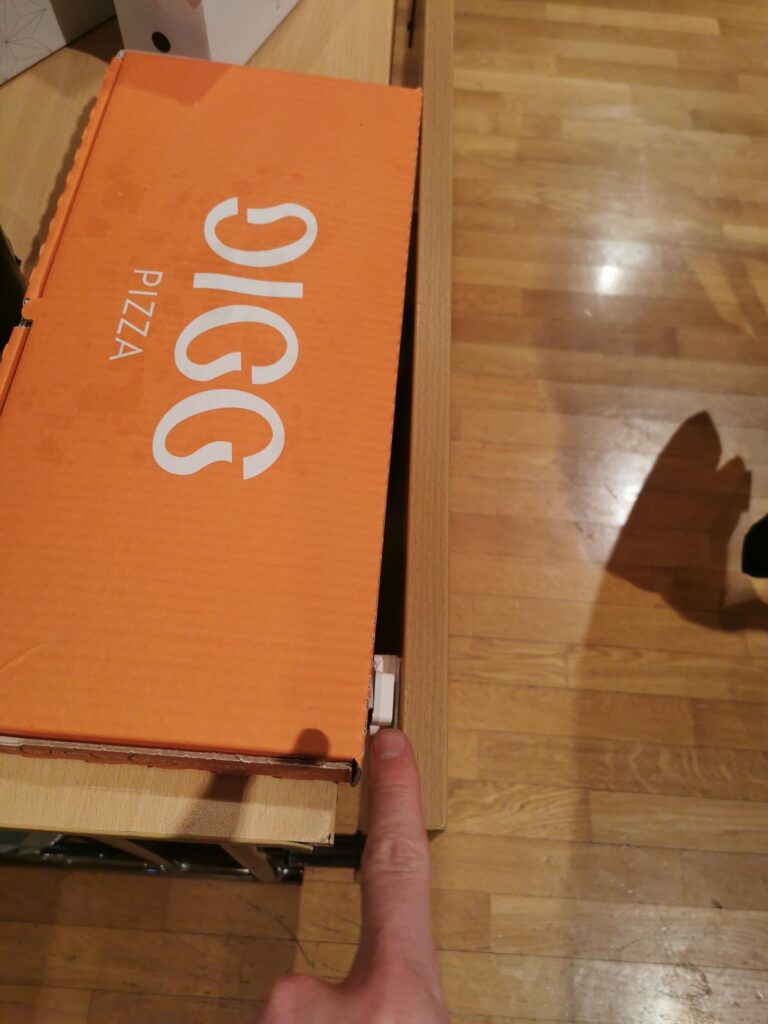
Pointing at the small sensor for delivery. Temperature is inside the box

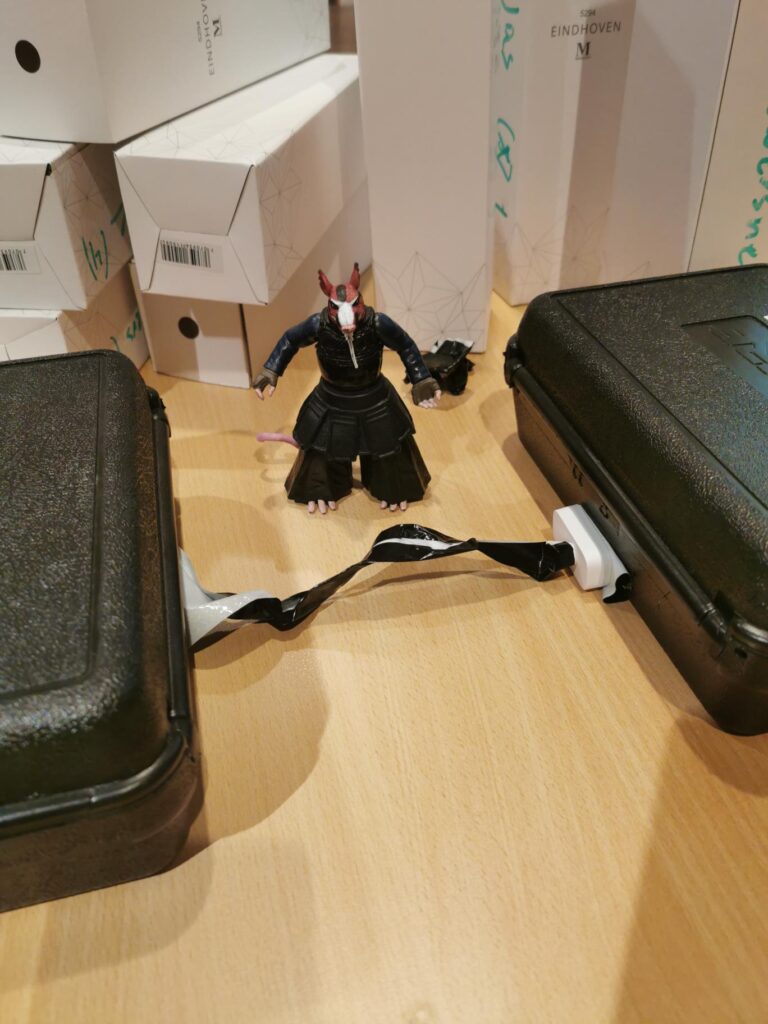
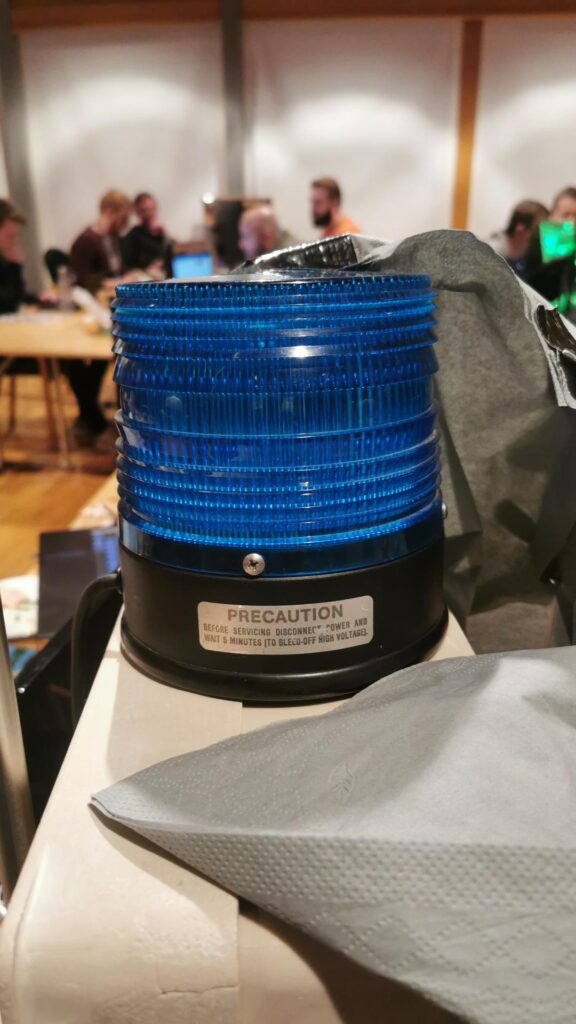
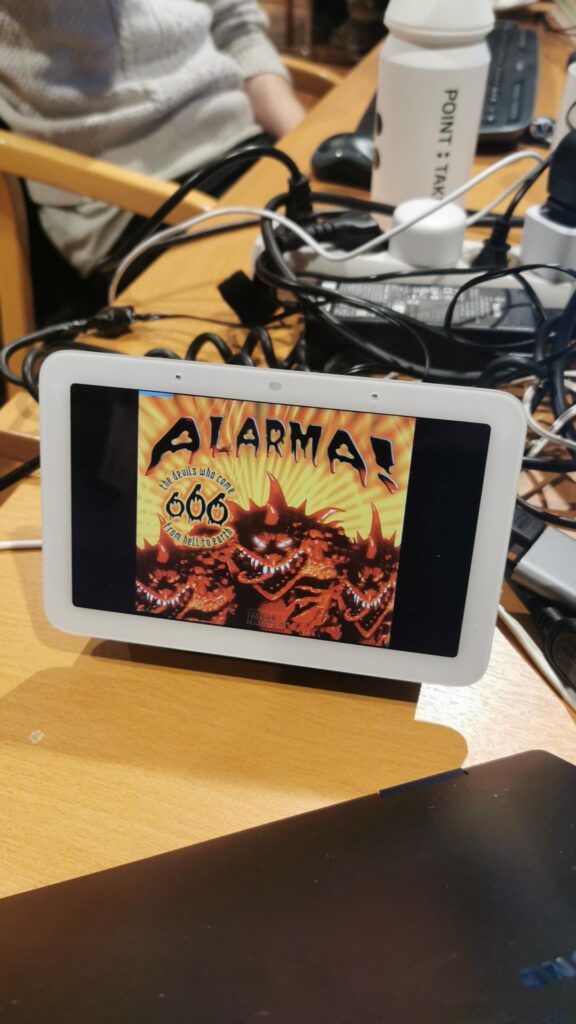
HQ security has been upgraded with a functioning trip wire. Not only will the emergency lighting device blink, the beacon will change color and the speakers will start playing ALARMA – 666 full power to notify everyone at the headquarters.

Bad Guy close to the trip wire!!
WARNING!!
Speaker playing warning song!!

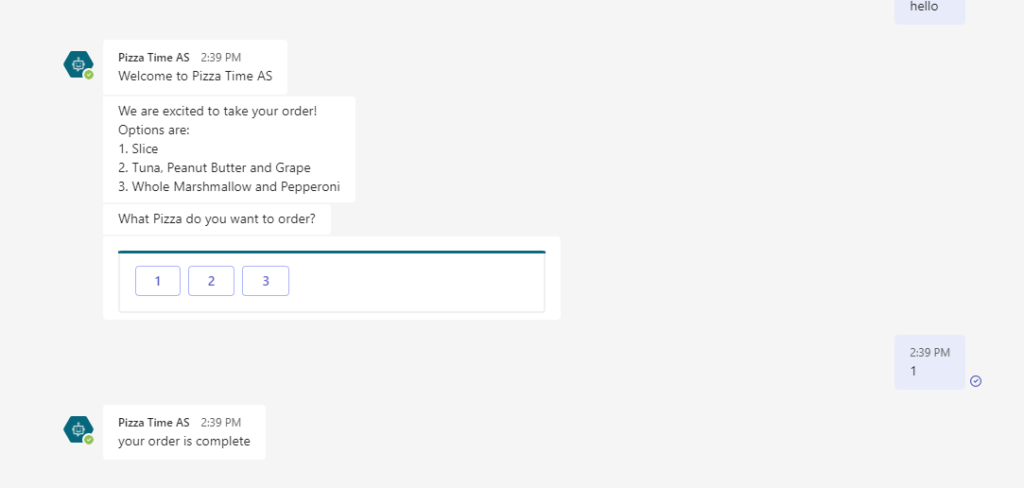
We also managed to get a Power Virtual Agent chat bot in Teams where the turtles can quickly order pizza while chatting to the bot. The order goes into Dataverse, and the lights start blinking like crazy as usual! 🙂

Eivind

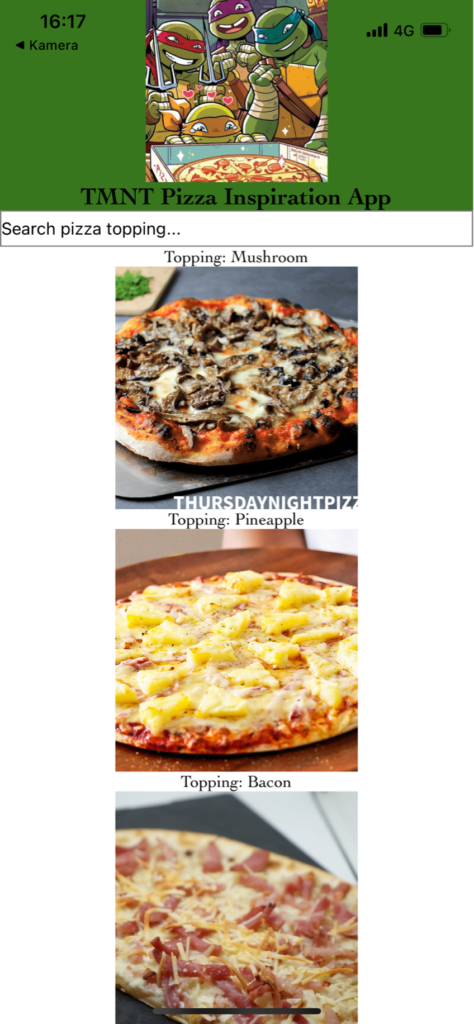
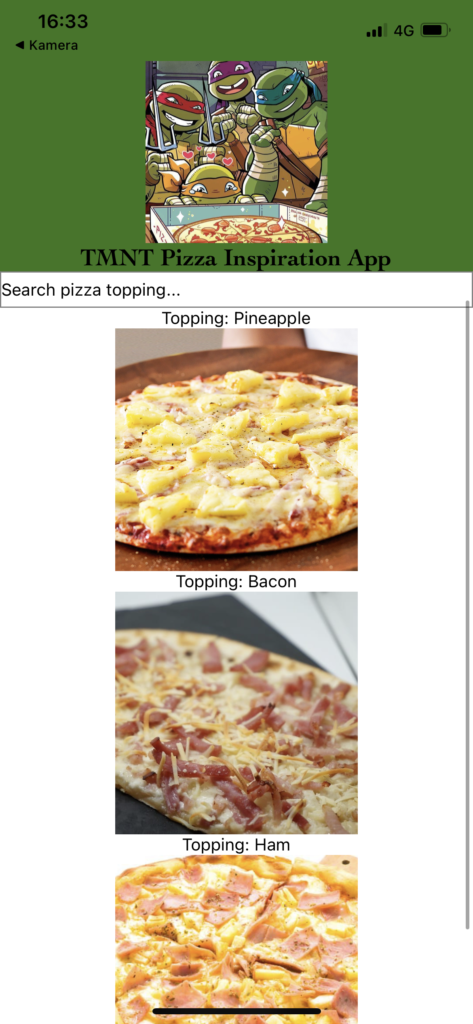
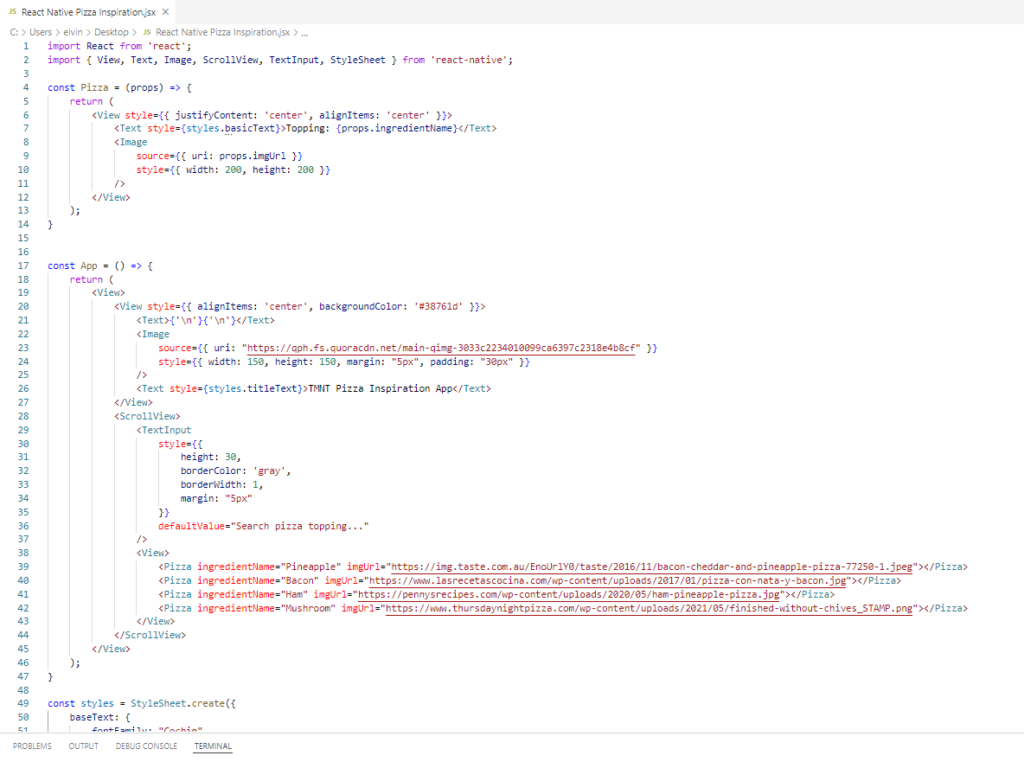
Eivind wanted to help customers get inspired by new pizzas. He has been created a Native App with react native to create a Pizza Inspo page. Browsing this customers will get hungry.

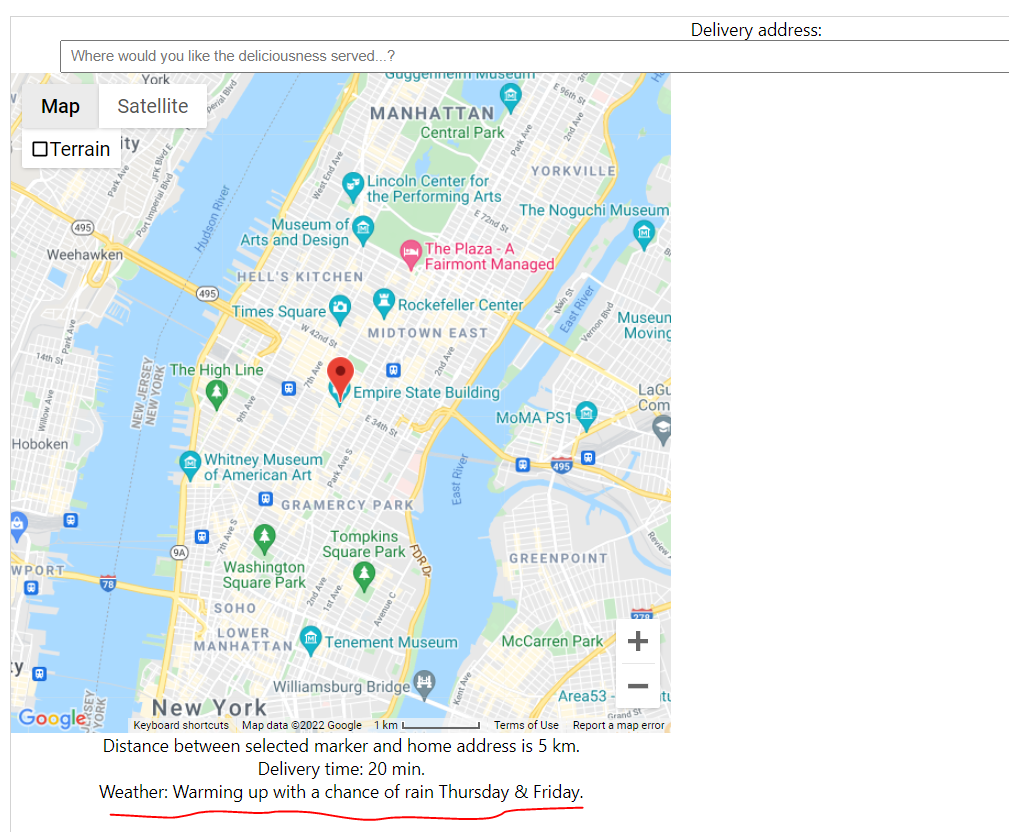
For the ordering process he has been working on weather API inclusion. This way we can show the users what the weather is like now. For the next release we are aiming at altering the estimated delivery time based on the weather data. Bad weather will increase delivery time etc.

NB! The orders from the Portal also works writing to Dataverse.. Again no images, but out beacon light will flash for every order!! 😊

GET INSPIRED -> GET HUNGRY

Inspired customers are hungry customers, hungry customers are paying customers. TMNT are of course aware of this and have released the Pizza Time Topping Inspiration App. The app lets users search or scroll through all available pizza toppings you can imagine, perhaps discover some new ones, and most important… get them to order pizzas through the plethora of Pizza Time ordering options:
– Pizza Time ordering website (Power Apps Portals)
– Pizza Time on-site ordering app (Canvas app)
– Pizza Time ordering chatbot (Virtual Agents)

Team Pizza Time believes in giving the customers options, so they can order in the way they prefer.

The Pizza Time Topping Inspiration App is created using React Native. Write once and run both on iOS and Android 🙂

PowerShells Day 2

In this post, we will demonstrate using images and text to show the judges what we have developed and created since yesterday.

We have sorted our data in DataVerse to properly store everything we need to show the end customer. So today we have been creating a couple dashboards for our end users.

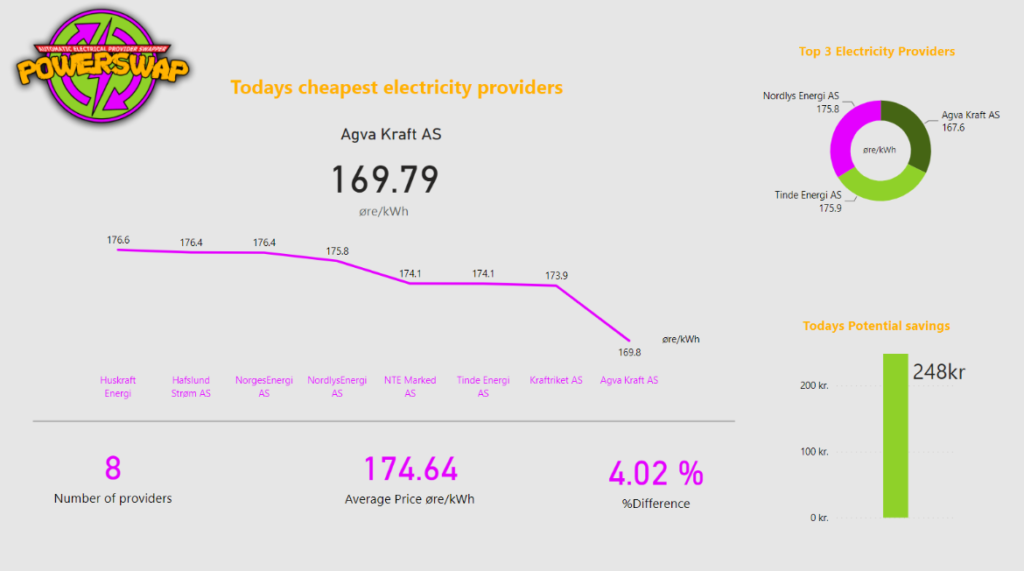
“Today’s Overview” page are showcasing today’s electricity price and the provider with the best and lowest price. It is easy to compare between electricity providers and get an overview of how today’s market behaves. You can also see your maximal potential savings.

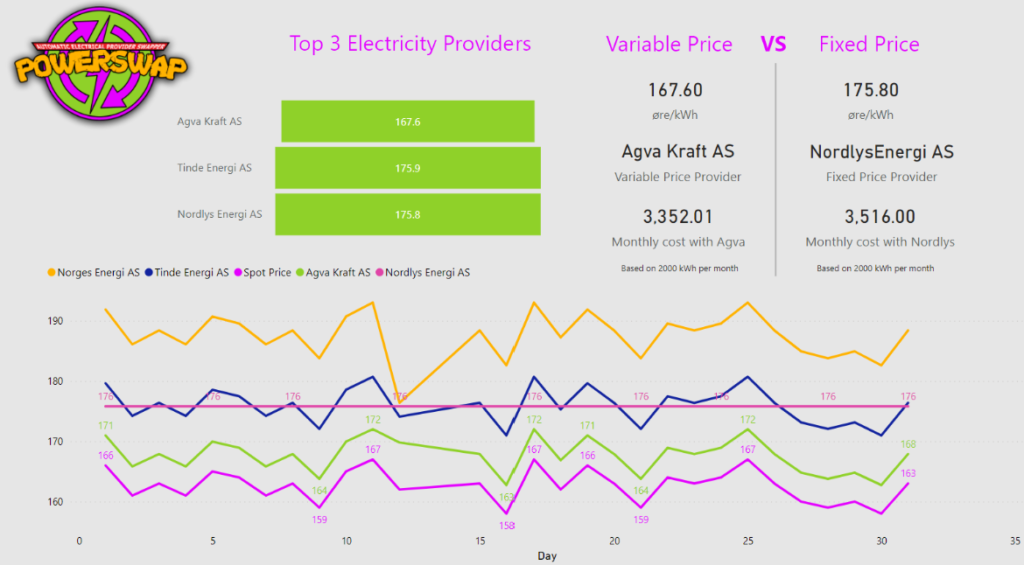
The “Electricity providers last 30 days” page gives the customer an even greater overview of the current market situation. All the electricity providers are matched up against the Spot Price, and it is easy to spot the providers with the biggest fees. We have also included a comparison between the cheapest variable price and the fixed price.

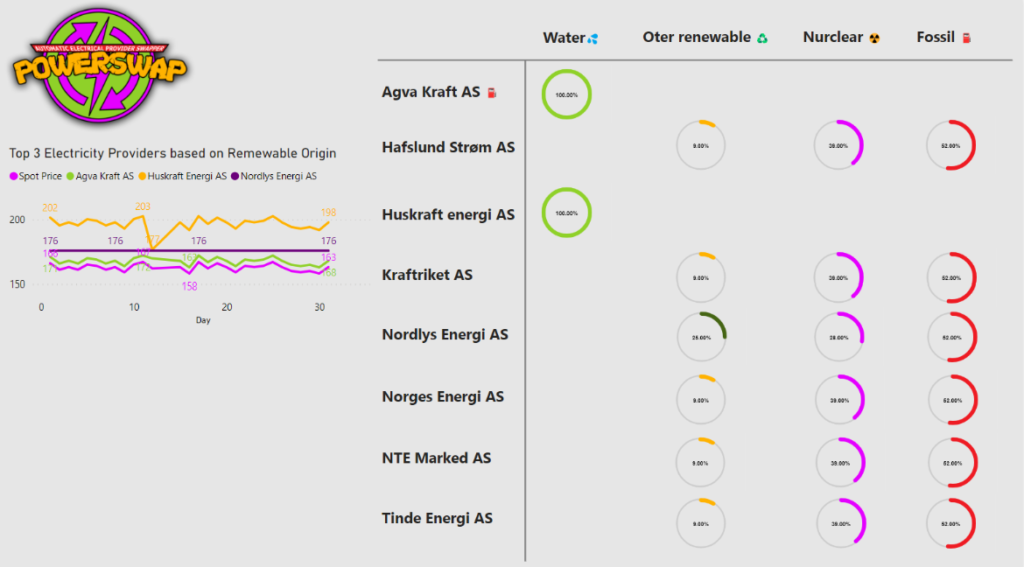
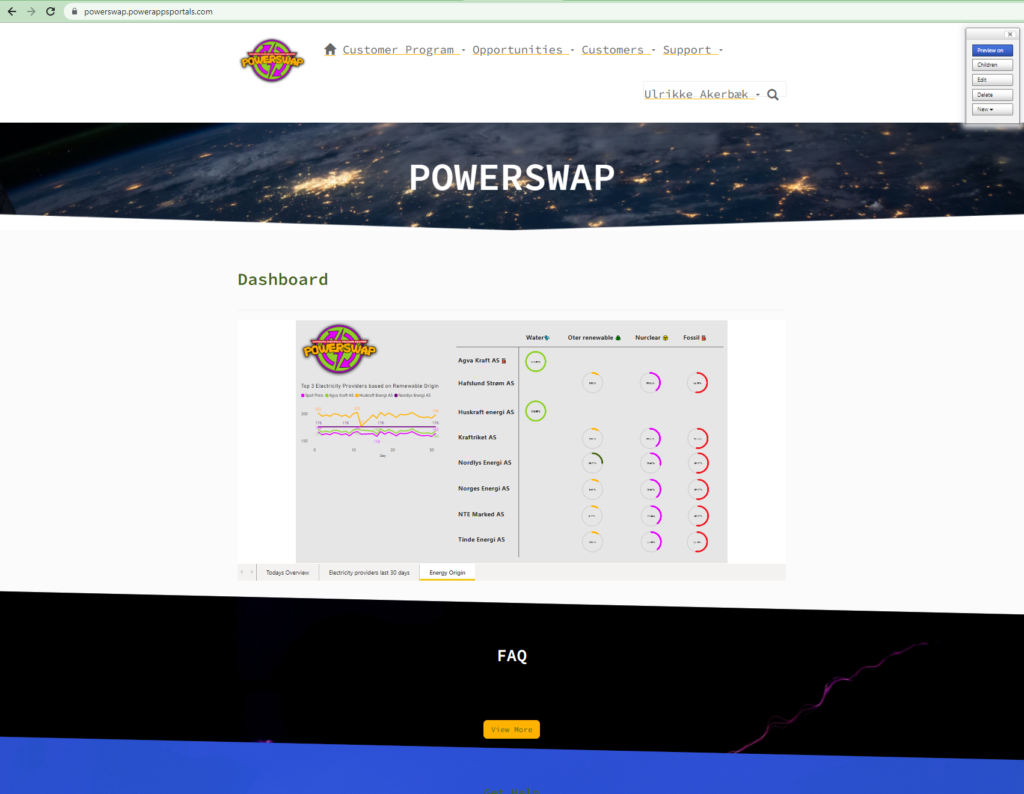
We have created a great-looking dashboard with three pages for potential and current customers. “Today’s Overview” page are showcasing today’s electricity price and the provider with the best and lowest price. It is easy to compare between electricity providers and get an overview of how today’s market behaves. You can also see your maximal potential savings. The “Electricity providers last 30 days” page gives the customer an even greater overview of the current market situation. All the electricity providers are matched up against the Spot Price, and it is easy to spot the providers with the biggest fees. We have also included a comparison between the cheapest variable price and the fixed price. The “Energy Origin” page gives you an overview of where the electricity is generated between the providers. And to the left in the graph, we can analyze the top three providers with the most renewable electricity and compare it to their electricity price

Embedded dashboard

We have embedded the dashboard in a Power Apps Portal for our customers to view. This will serve as a dashboard for them to get an overview of their spending.

When the user is logged into the portal they see the power bi report on their home screen.

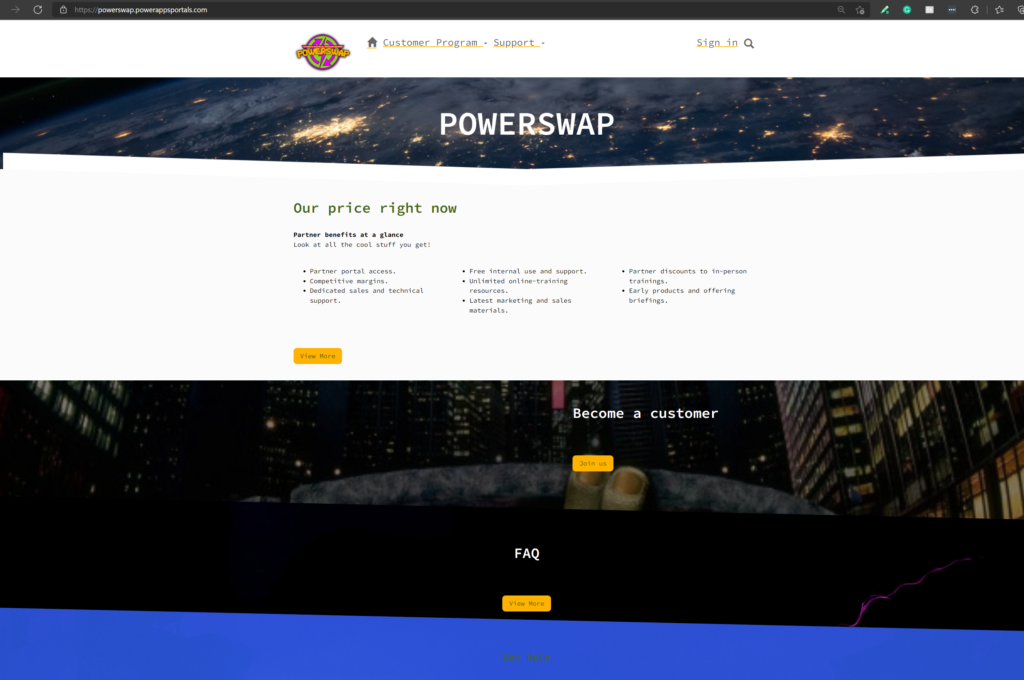
If a user visits the portal without logging in the report is not shown, and instead, they get information about what we offer to our clients, and a section for “Become a customer”

The Portal

This user portal is built with Power Apps Portals. It’s user-friendly, responsive, and accessible.

Use this QR-code to see the portal on your phone:

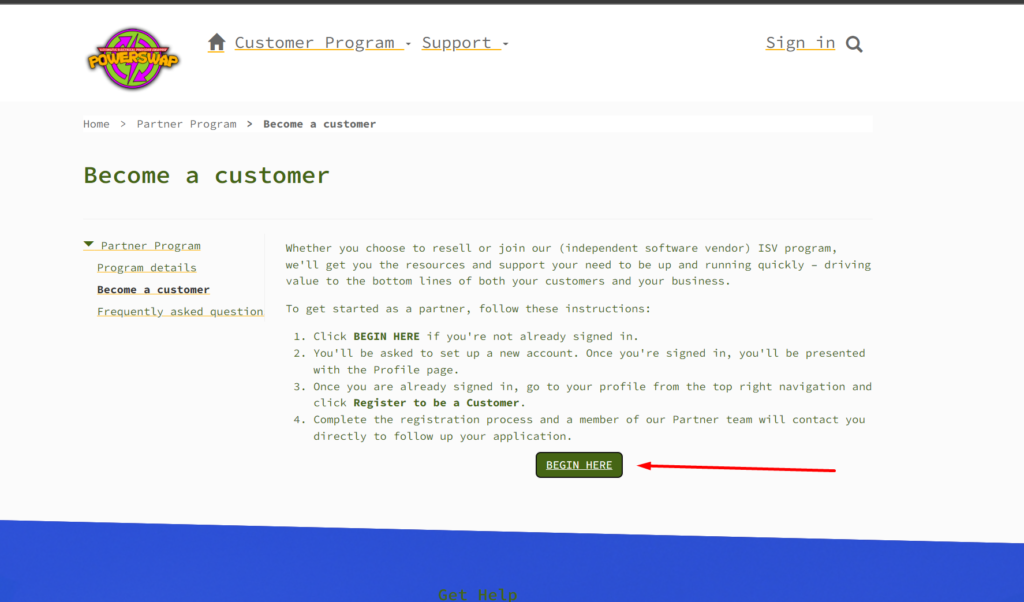
Become a customer

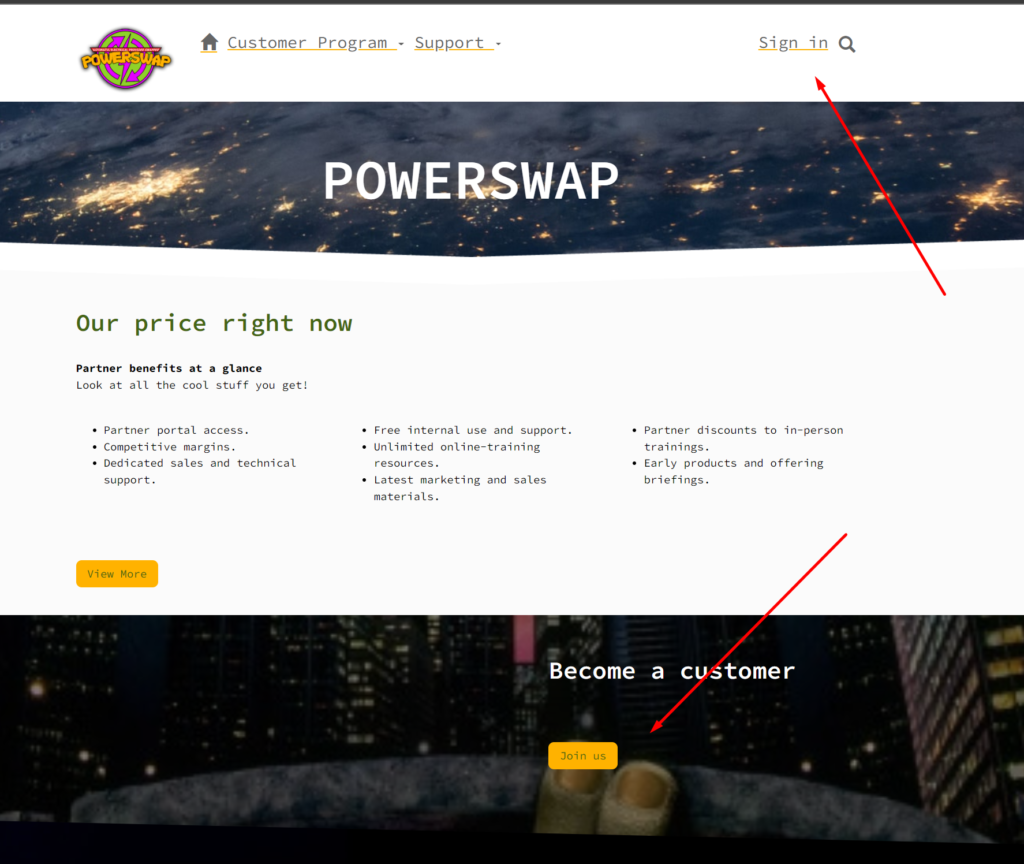
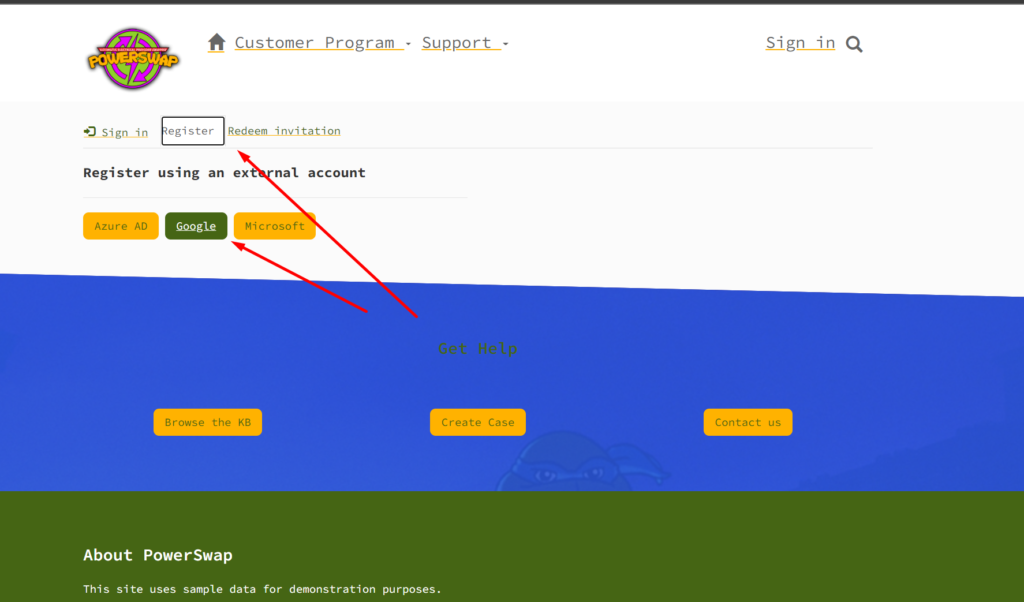
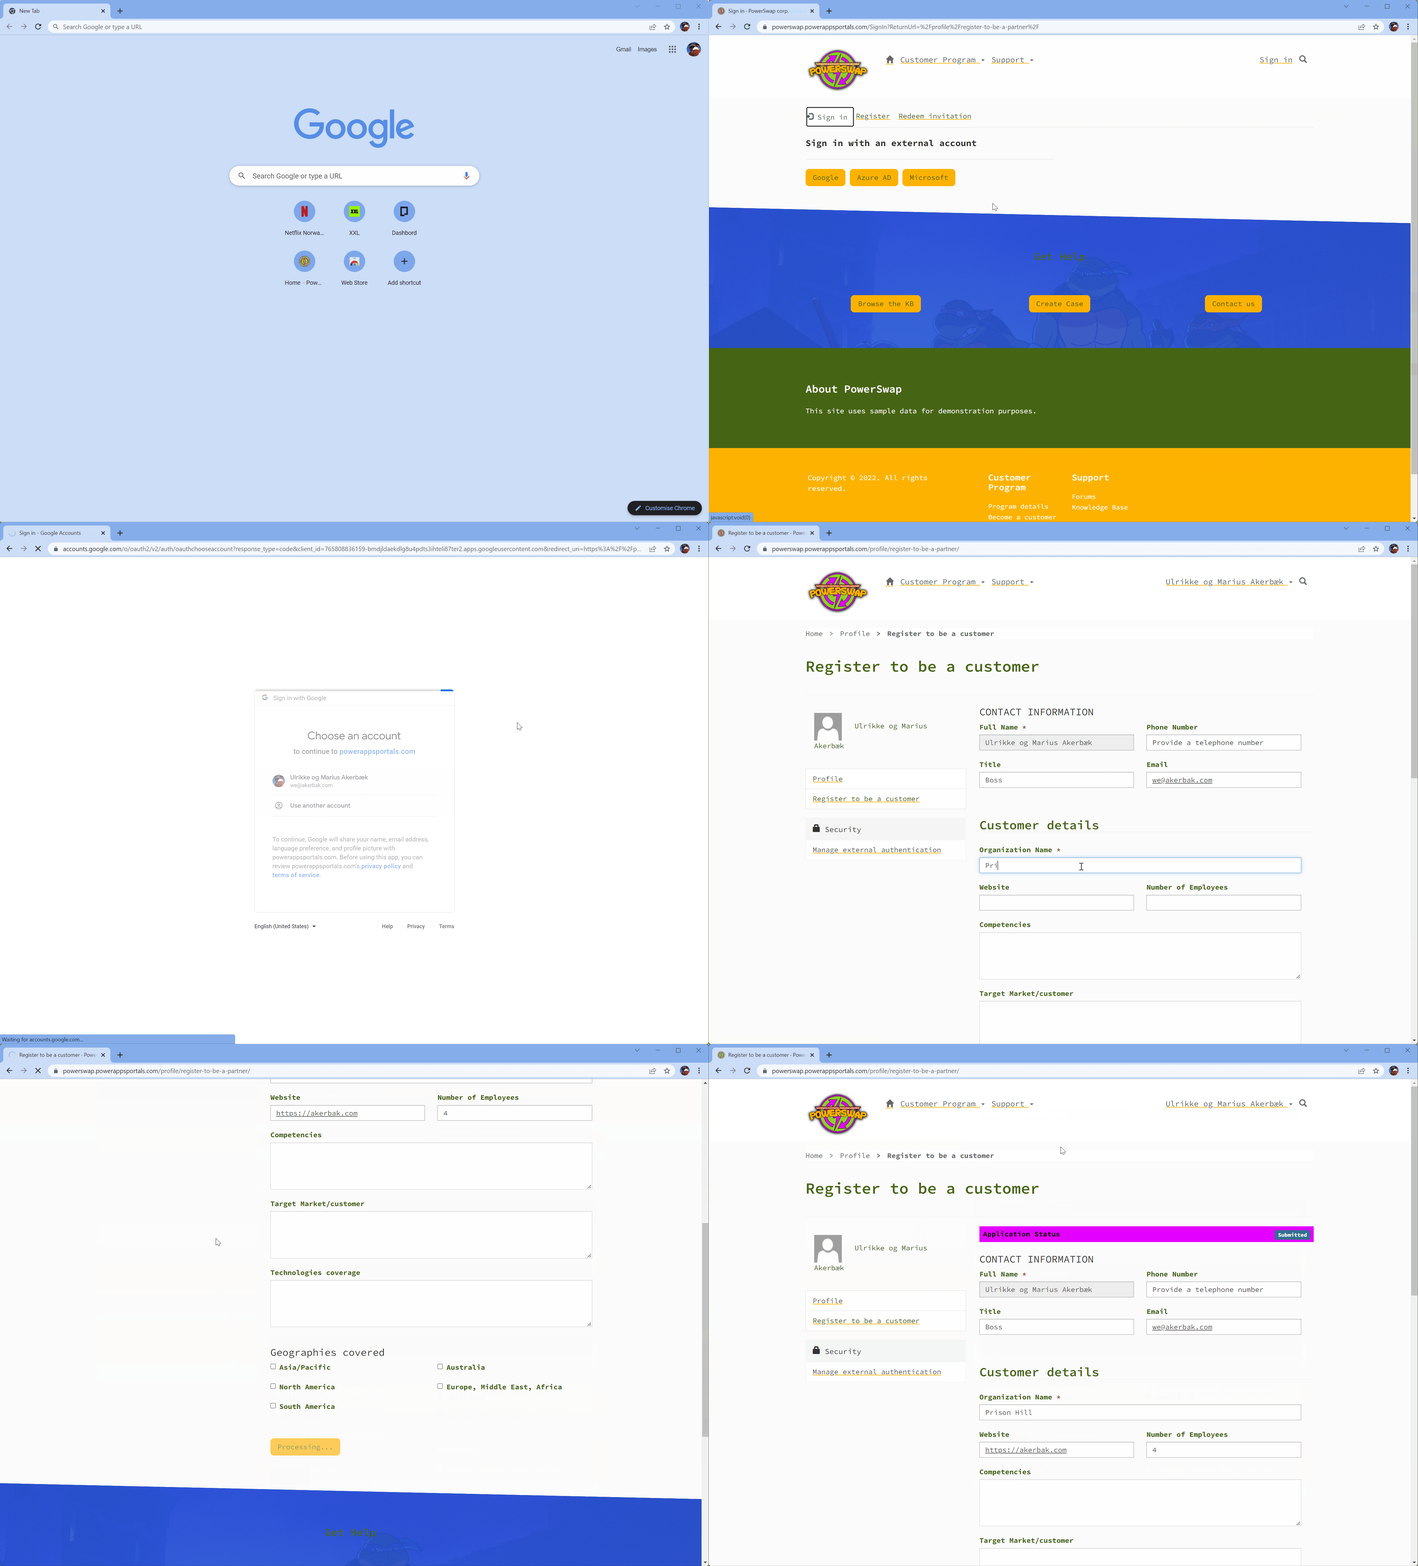
You can register as a user and log in with Microsoft or Google account. New users click “Login” in the top menu – or click the “Join us” button in the “Become a customer” section on the home page.

Clicking the “Join us” will take you to an information page telling you more about our offering and let you start the process of becoming a customer:

Clicking “Begin here” takes you to the “Sign in” page. You can register as a user by selecting the “Register” tab.

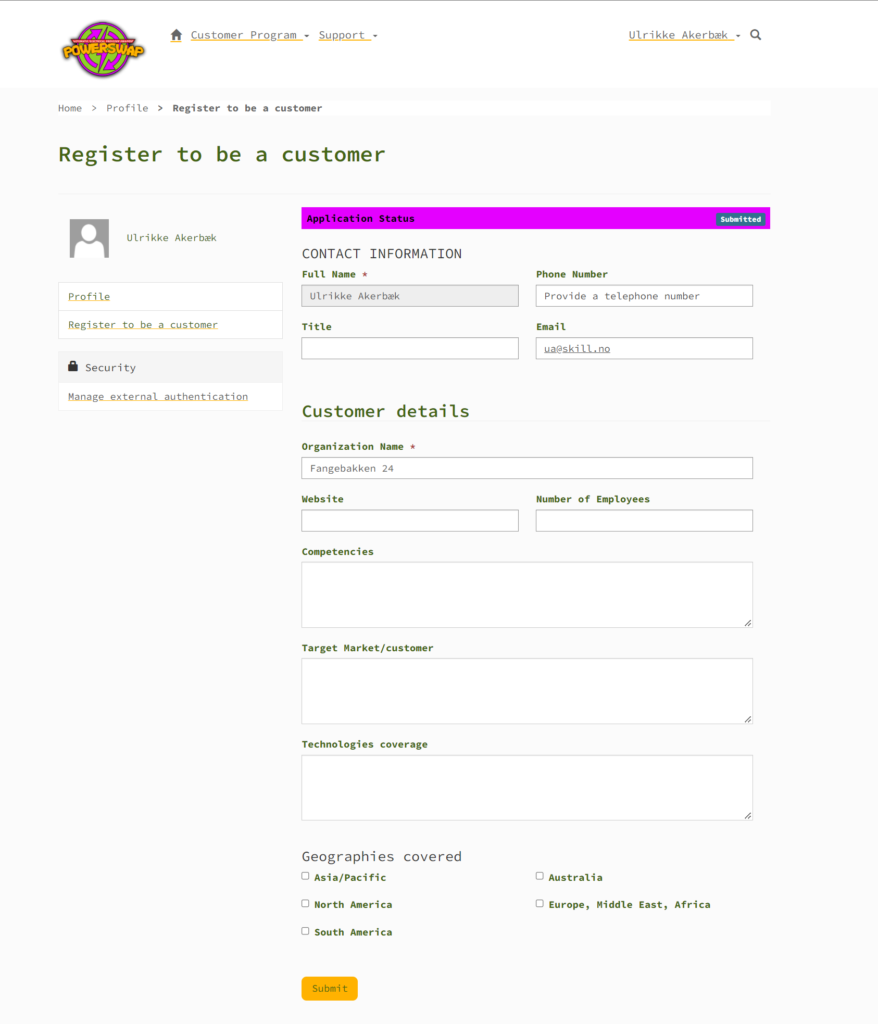
When you have access to the portal as a new user you are able to register to be a partner. Right now the form is a default form, but we will add options here for customers to choose what kind of electricity they want (green, cheap, or destructive).

When the application is sent, it appears in an app for the salespeople to review.

What’s next?

We’re working on a Canvas App for salespeople on the go, where they can accept/deny applicants and sign new customers.

Then we’ll set up flows that automatically send emails to new customers when they apply and also when their applications are denied/approved.

Our first customer

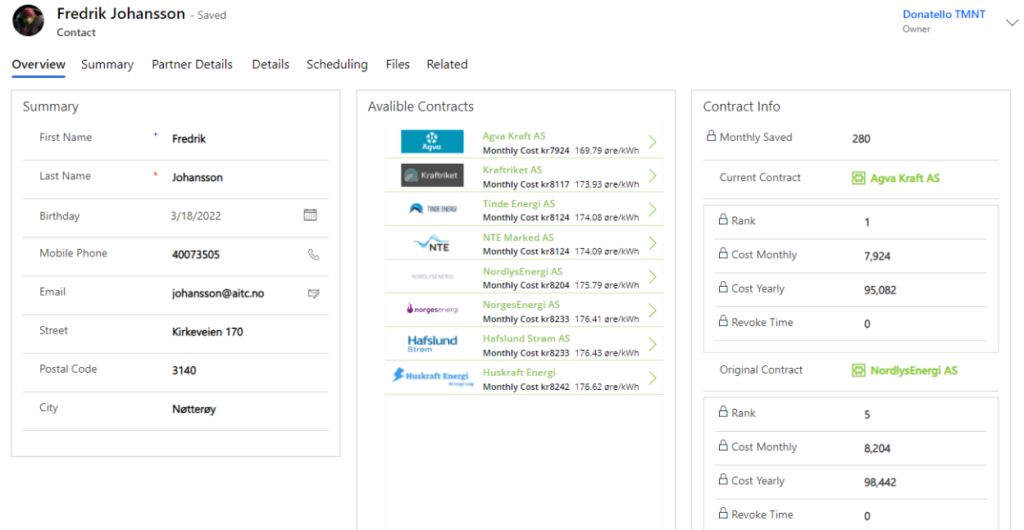
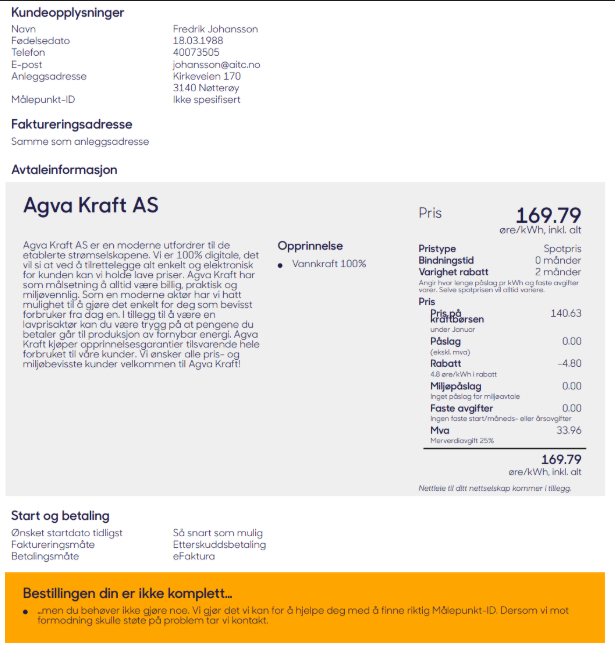
We were also able to test our solution on a real customer, Fredrik was the first man out to test this functionality on this home.

Our first customer has signed up and automatically changed his contract

He also received a receipt

What about grandpa without Bank ID for mobile?

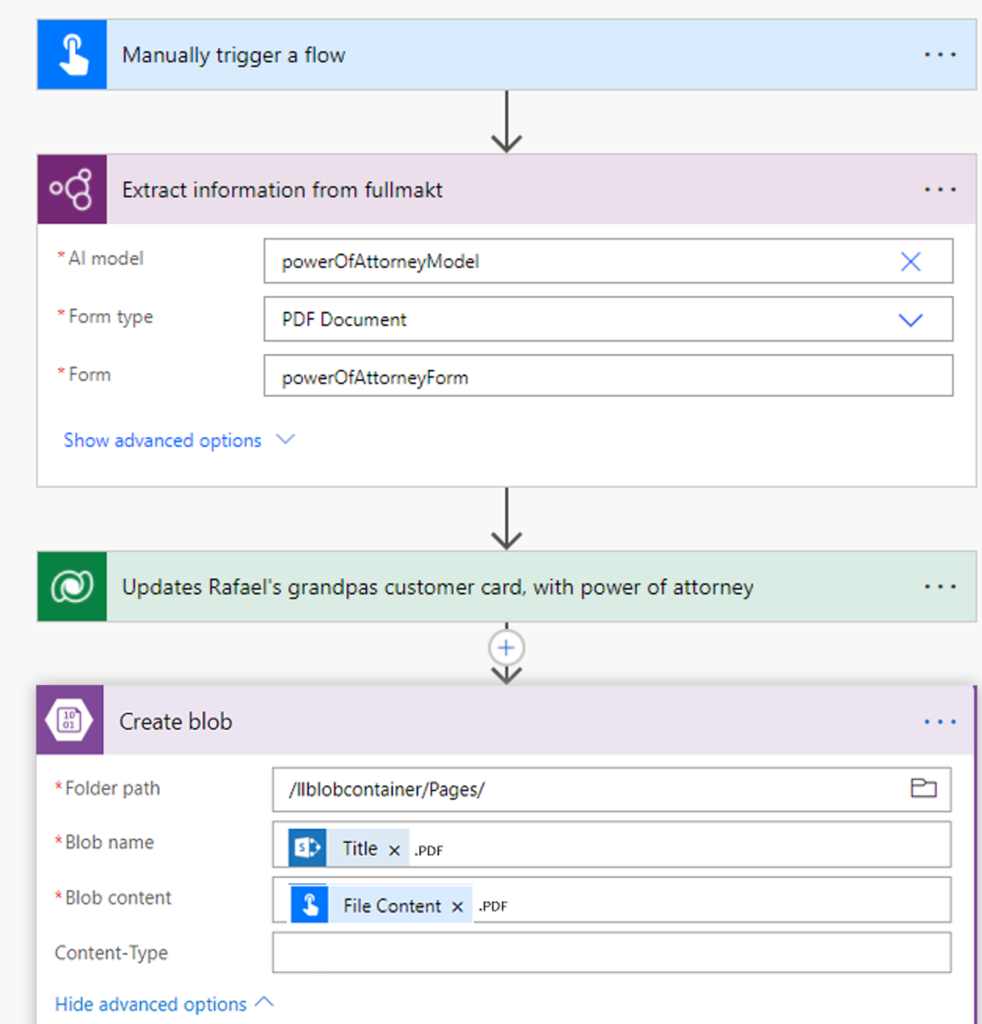
Rafael had a concern when he recommended this deal for his grandpa because he was unable to sign with Bank ID for mobile. So it would be necessary to write a paper contract, scan this and submit it to us.

We created a flow to receive this document, and build an AI model to read out the content and add the relevant information on the contact form. Then we stored the document in an Azure blob for the archive.

Business value and how we are going to make money from this business idea

Our services are proven to be a great business idea and an idea that adds value for our customers. But how are we going to make money and maintain a healthy economy within Power Swap?

For now, we have two main income sources, the first one is the “Swap Fee”. Swap fee is a one-time fee we will charge the customer every time they swap electricity providers, but we will not charge any fees if the swap didn’t save the customer any money. We will only charge the customer 10% of the amount our customer saves on a swap. This means that we have a low-cost service and a service that benefits both parties only when a swap is profitable. 10% of a profitable swap may do not seem much of a profit, but remember this is a service that will swap providers in high volume, and with a customer base in Norway of 3.2 million and an even bigger customer base overseas, will this fee be a great income.

Our second income source will be our “Premium Providers”. Premium providers stand for a group of electricity providers that pay us a monthly fee for being a part of our premium program. So now you may ask yourself, what is this premium program? Let us tell you… A premium program is a group of providers that we will treat as a preferred electricity provider when two or several providers offer the same electricity price. If the are two or several providers with the same electricity price, that both are “Premium providers” we will run a randomized picker and choose one of them.

How do we communicate with all the contract vendors
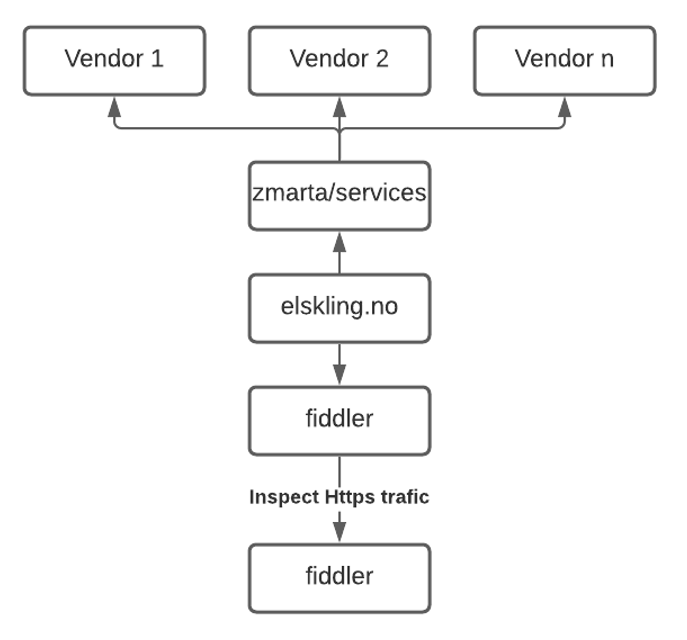
First, we found a basic site that that have a list of all contract vendors.
We reversed engineered their solution with fiddler in order to find what apis they used.
We found one for the contracts and one for signup.
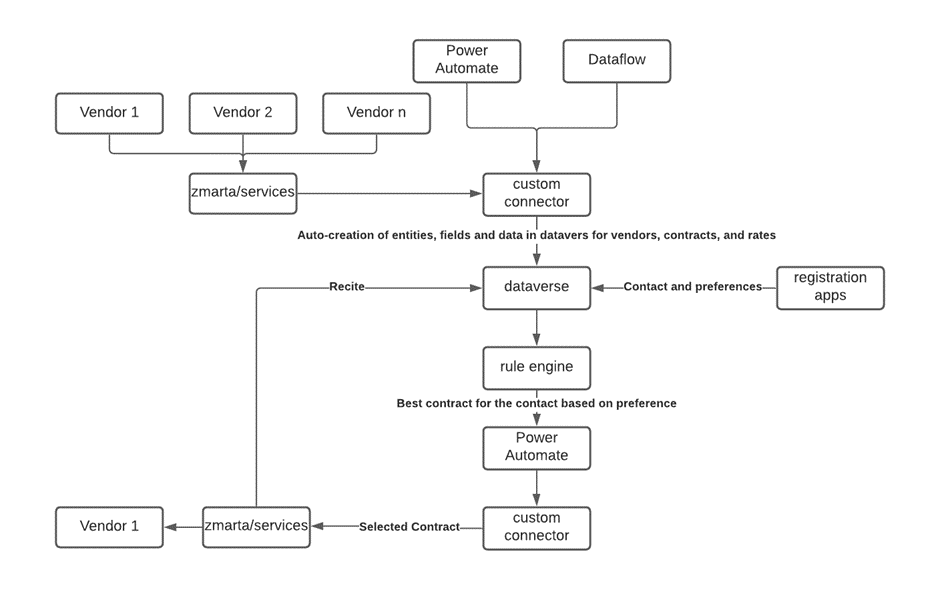
From this api information we created our own custom connector, so all the apis we need are available in the Power Platform

This is how we than use the connector to get contracts and change customers contracts on an hourly schedule.

Todays progress

So far so Good 😊, we have done some modifications to our solution and have now established a more attractive business value and some better user interfaces and data integrations.

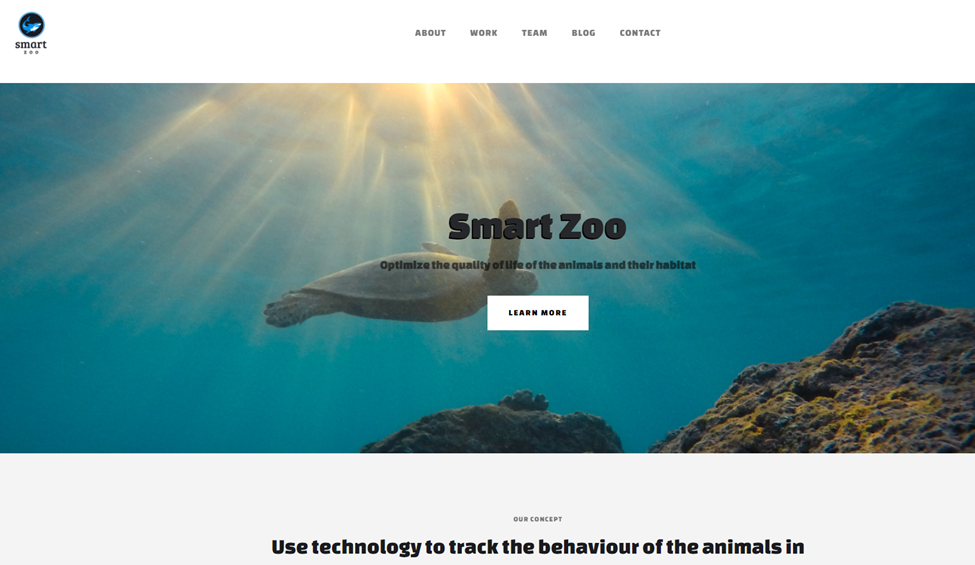
First of all the new idea is to reduce the monitoring space and range, so we came up with changing the scope and customer type to: ZOOs. Our new brand is: SmartZoo.

In each ZOO we can find different species of animals living together in controlled habitats, they have very different needs and behaviors, that is why we needed an adaptable system that could receive information from different IoT devices measuring different types of data.

Our platform is “device ready”, it means that we can include new devices in an easy way by using the concept of “device groups” which allows us to differentiate animals by grouping IoT devices based on species.

Our final goal is to implement Smart ZOO in multiple locations around the world in different ZOOs and get Insights from all of them so we can identify anomalies, improve facilities and procedures and last but not least increase sustainability by optimizing the use of resources like electricity, food and water.

We created a web page to be presented to possible customers, it is responding very well to different screens and devices and it is a good entry point to get in touch with us. The URL is: https://smartzoo.webflow.io/

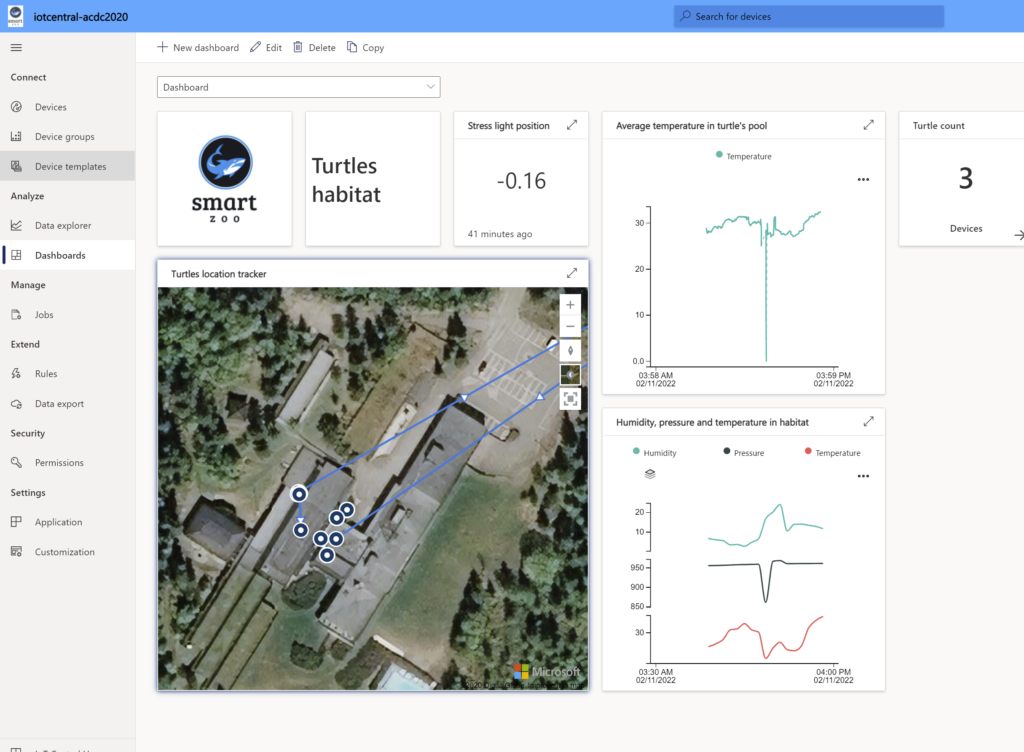
We have created a dashboard, in IoT Central, with data from the IoT devices (smarthphones + IoT DevKit). IoT DevKit provides data of temperature, pressure and humidity.

We are tracking the turtles locations in and showing it in a map. We want to use this information to send alerts if turtles escape their cage. We also want to generally gather information about their movement, which can be used to tell if a turtle is sick or hurt.

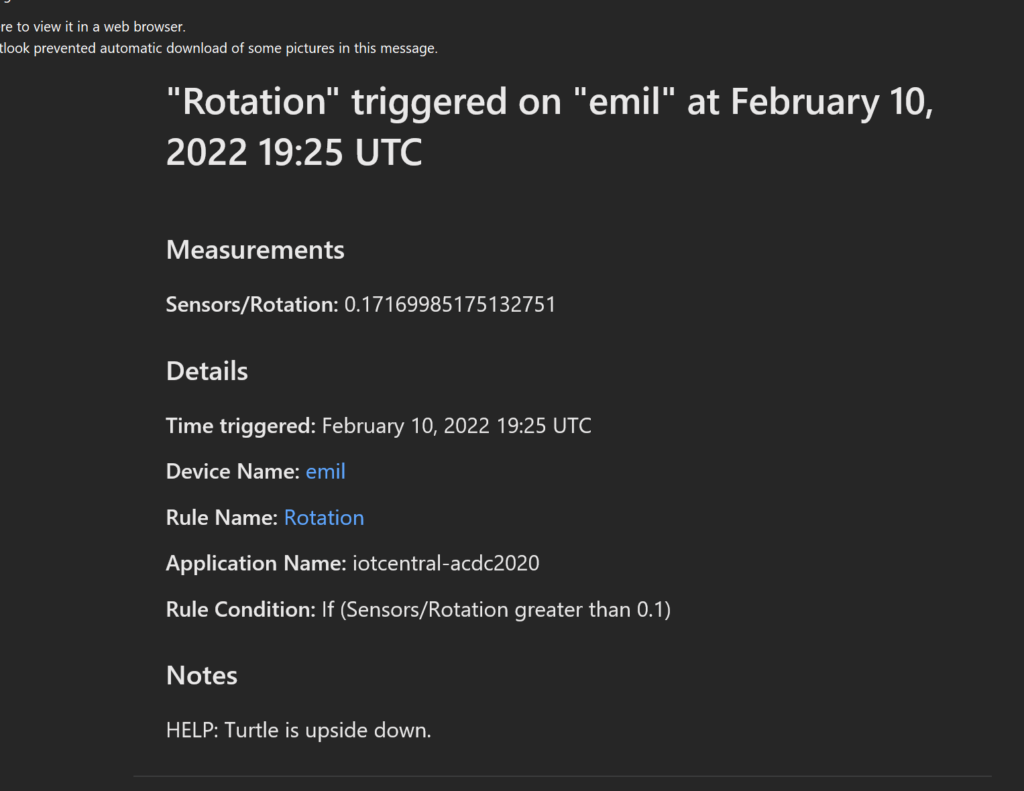
Smartphone (turtle) devices provides gyroscope (x,y,z) which tell how the rotation is for the smartphone (turtle). We are using this to provide information if the turtle is turned upside down (the worst thing that can happen to a turtle…). If the turtle (smarphone in our case) is upside down a rule is trigged and an email is sent to the zoo keeper and the light on the smarphone is turned on.

Logic app:

Email:

Light turned on the smartphone:

Machine Learning

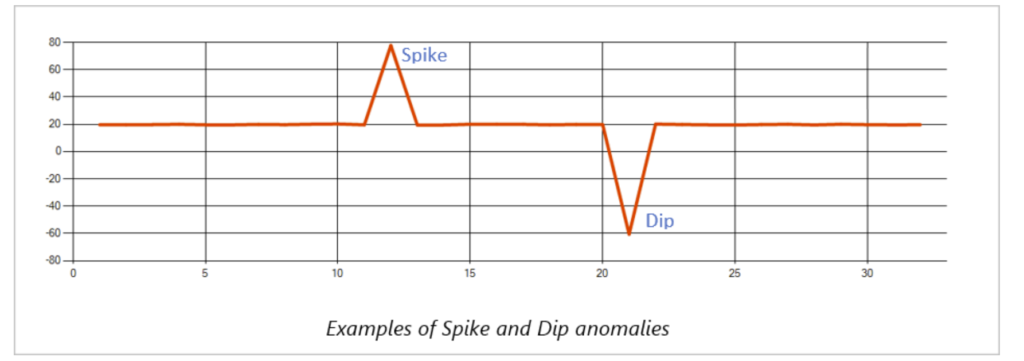
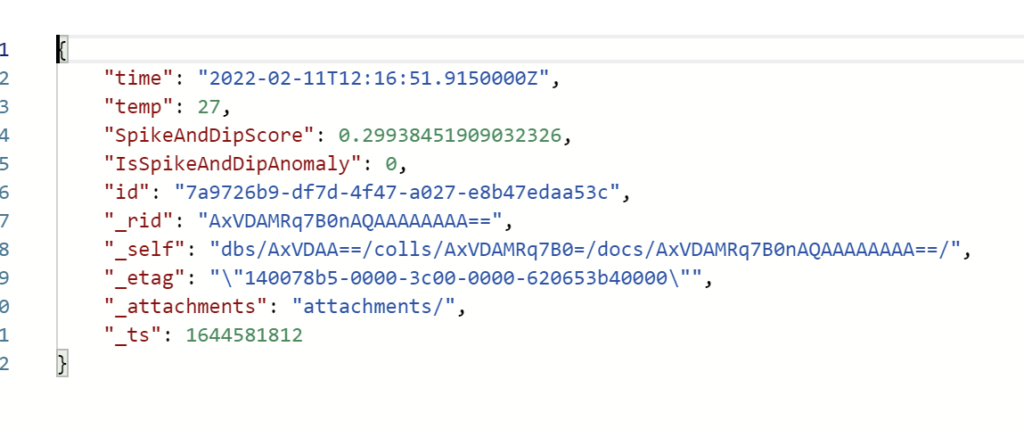
We are currently working on implementing machine learning such as anomaly detection. If there is any spikes or dibs in the temperature value want to store this information in CosmosDB and send an alert message. This can detect any abnormal behavior in any of data we are collecting, and automate the job of alerting relevant people of what is happening.

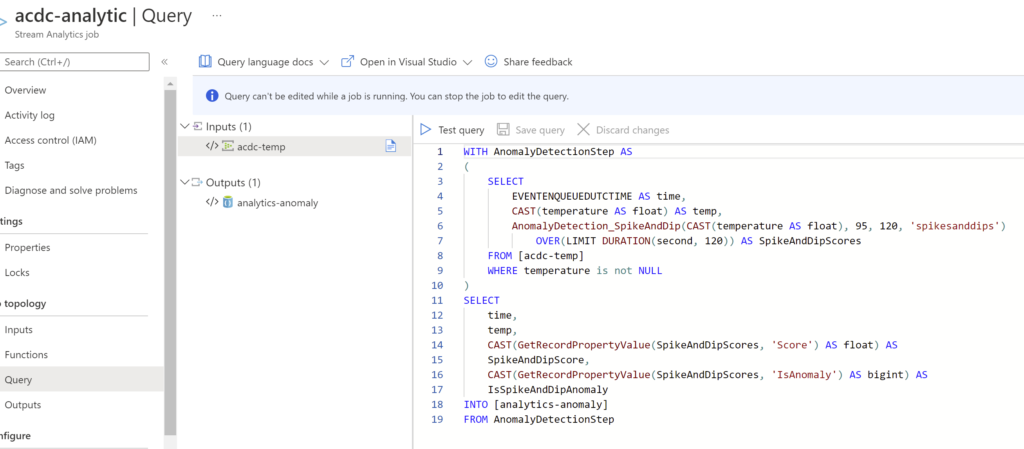
We are gathering temperature information from the Event hub, sending it to Stream Analytics Jobs to detect anomaly and sending output result to Cosmos DB:

CosmosDB:

WebApplication

We have implemented Geolocation with SignalR so the markers are shown in the map in real time. When the devices are in motion the markers will move at the same time.

The front end calls the Hub so it does not need to call the controllers each time with a common Http call.

Excellent user experience

Here we can include all changes to our branding and webpage. IoT central got also a new brand and it is much easier to identify the different habitats per species in the dashboards.

We have also improved the responsiveness of some of the visuals in the IoT central by implementing signalr and React.

Most extreme business Value

We tried to explain it in the overview of this POST, but as we mentioned before, the real business values comes when getting data from different Zoos and produce Insights and make decisions based on it.

Rock Solid Geekness

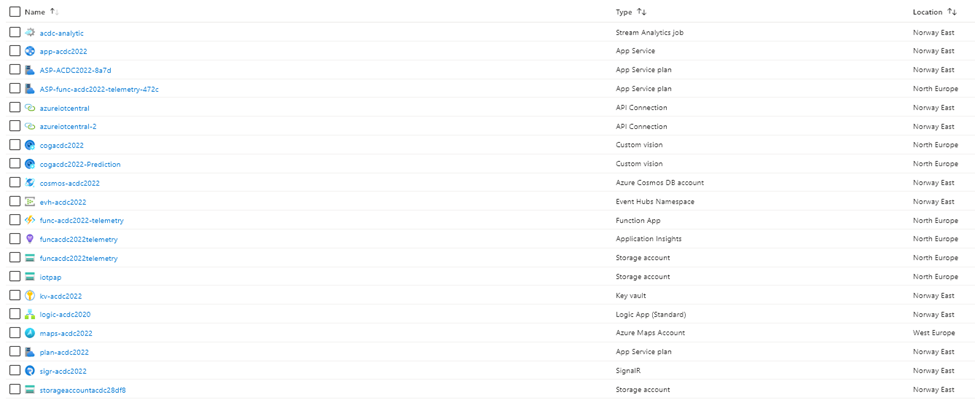
Here is an overview of technology used:

Killer App We find it difficult to explain how it is a killer app, but we hope it is enough with all the previous text 😊

Hva har vi gjort i dag:

Våre endringer fra i går til i dag: 

Excellent user experience 

Vi har en applikasjon (canvas app) som besøkende av Munch-museet kan bruke. Siden i går har vi gjort følgende for å forbedre brukeropplevelsen: 

  1. Du kan nå kommunisere med vår chat-bot direkte i applikasjonen. Vi brukte en PCF-komponent for å legge inn chatboten som en iframe.  
  1. Vi har fullført funksjonaliteten som lar brukerne ta bilder og få mer informasjon om kunstverket ved bruk av AI Builder (Se tidligere post og video). 
  1. Besøkende kan nå besøke vårt digitale museum med både bilder og behagelig bakgrunnslyd som støtter opp under opplevelsen av museet. Museet kan også brukes med VR briller for de som ønsker det.  

Rock Solid Geekness 

Siden i går har vi forstått at vi har litt å gå på når det gjelder geekiness-nivået. Vi har derfor jobbet mye med en app for de ansatte ved museet der vi får opp data fra sensormålinger i utstillingsrommene som skal visualiseres i PowerBI. 

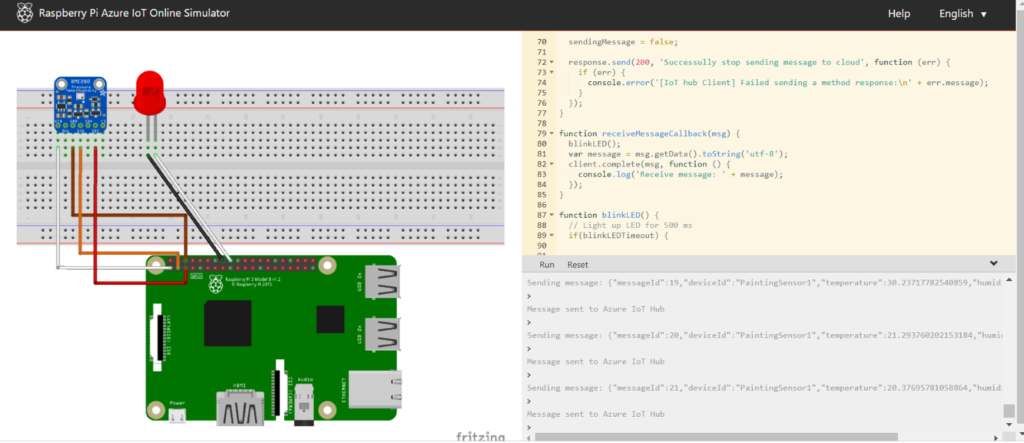
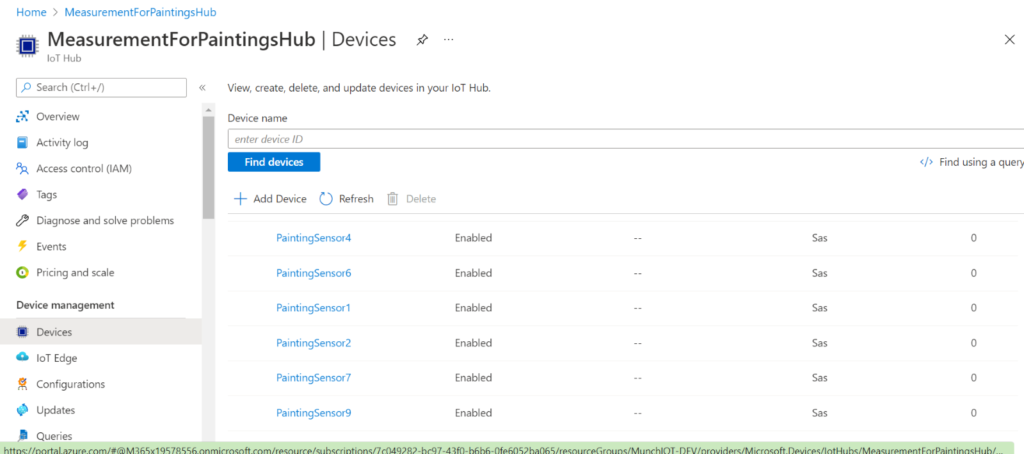
Siden vi ikke har tilgang på noen IoT-enheter (😢) genererer vi målingene ved bruk av simuleringer fra en Raspberry Pi web simulator: https://azure-samples.github.io/raspberry-pi-web-simulator/ som vi har ti instanser av og skriver til ti forskjellige enhetregistreringer i IoT Hub i Azure.  

Denne dataen blir så tilgjengeliggjort i endepunktet til som er innebygd i IoT Hub som igjen trigger en Azure Function App som skriver til Dataverse.  

Most Extreme Business Value 

Virtuelle museum: Det virtuelle museet kan bidra til å generere penger og interesse rundt museet selv om det ikke er åpent, men også i form av interesse for NFT kunst og kunstverk lånt fra andre museer.  

I tillegg lar det museets kuratorer vise frem en større del av kunstsamlingen som totalt består av nærmere 28 000 kunstverk. I dag er kun en liten andel av disse tilgjengelig for publikum. 

Bildegjenkjenning: Ved å legge inn mer informasjon i applikasjonen i stedet for ved siden av kunstverket kan vi bruke plassen på veggen til å stille ut enda flere bilder.  

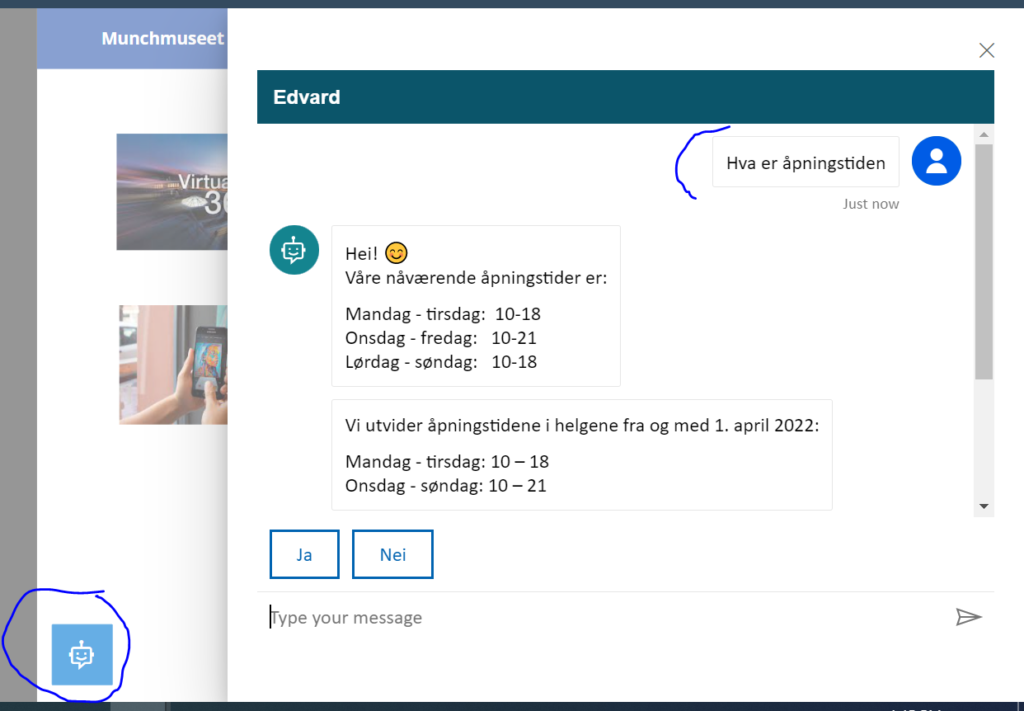
ChatBot: Chatbotten kan nå avlaste ansatte slik at de besøkende heller bruker applikasjonen enn å kalle på de ansatt for hjelp. De ansatte kan da bruke arbeidsdagen på mer verdiskapende oppgaver. 

IoT: Ved bruk av vår IoTl-øsning som monitorerer temperatur og fuktighet rundt kunstverkene, vil spare museet for store utgifter: 

  • Ved bruk av IoT-løsningen kan lufteanlegget kjøle og varme opp rommene som trenger det 
  • Minimere skade på dyre uvurderlige malerier grunnet fukt 
  • Færre ansatte som flytter på malerier grunnet dårlig temperatur og fuktmålinger 
  • Unngår å måtte stenge Munch eller redusere antall besøkende i løpet av sommeren når det både er varmt og høy luftfuktighet 
  • I fremtiden ønsker de å styre lufteanlegget basert på sensorata. 

NB! I Munch museet har vi underdimensjonert lufteanlegget og kommunen ønsker ikke å gi støtte for mer utbedringer av denne! Deres store frykt er at den store antall besøkende på sommeren og den høye sommertemperaturen vil gjøre store skader på flere kunstverk. 

“Munchmuseet frykter at klimaanlegget ved det nye museet i Bjørvika ikke vil tåle sommervarme og rekordbesøk. […] Nå får imidlertid Munchmuseet et tydelig nei fra PBE, skriver Avisa Oslo. Begrunnelsen er at det vil ødelegge byggets «særegne visuelle og arkitektoniske utrykk», heter det i artikkelen.” https://www.arkitektnytt.no/notiser/munch-sliter-med-klimaet 

Killer App 

Vi har endelig fått bruke vår AI modell i vår besøksapplikasjon! Se vår youtube video her:Illustrasjon av vår funkjsonalitet 

Vår nye Chatbot i besøksapplikasjonen tuter og kjører. Den ble både ferdigstilt og lagt inn i applikasjonen: Her trykket de på ChatBot ikonet og stiller Chatbotten spørsmål som den kan svare på 🙂 

Vi har også ferdigstilt museet med både musikk, malerier og NFT’er. Sjekk ut videoen i den tidligere posten her: https://acdc.blog/steria2022/virtuelt-museum/ 

Middle-Age Mutable Ninja Tuples has evolved!

A lot of improvements have been added to our solution, described in detail below. As different parts start to connect, we can see the potential value provided by our solution. Not just in crime fighting, but also as a competitor to food delivery apps like Foodora or Wolt, or transport apps like Uber or Lyft. Our now fully integrated solution includes apps for employees, the back-office and end users, and is easily applied to areas like those described above.

.NET MAUI app

https://streamable.com/fof2sw
Video of our app running on MacOS. Note: Some features are disabled when this video was recorded

We’ve just updated some design elements of our Ninja Turtle SOS App. It has a modern minimalist design. Because when you’re in an emergency you don’t want to have a confusing patterned background or 20 menus to click through. We are still improving on it but it’s feeling more modern already.

Our app is truly cross-platform. It works on iOS, Android, MacOS and Windows. The MAUI framework makes sure our app runs natively and uses device-specific buttons and UI. 

Two-way communication

The MAUI app now properly communicates with the gRPC service, giving it the ability to post SOS alerts to Dynamics and receive SOS status updates back, using a custom Dynamics API client. The status updates are streamed to the app from the server via gRPC.

The gRPC service is automatically deployed to an Azure App Service when we commit to master, using a GitHub Action. 

gRPC isn’t properly supported in Azure App Services yet, because of how new it is. Hopefully we can demonstrate the gRPC service working from Azure tomorrow – in the meantime it’s working fine running locally.

New feature: Google Maps!

When you need help from a Ninja Turtle it’s very useful to know where they are in relation to you. So we have now added Google Maps support to the .NET MAUI app. When a Turtle has been assigned to your distress call you will see a map of your area and live updates of your Ninja Turtles location. 

It’s a beautiful and easy to use feature that shows you where your Ninja Turtle and you are at any time. A small glance at the app and you know if they are close and you can continue to run towards your savior.

The Google Maps integration into MAUI was a challenge. We solved it by creating a React app that the MAUI app accesses using a WebView, basically rendering a website inside the app. The React app uses a Google Maps react library and is hosted as a separate web app (https://sosmap.vercel.app). We use CI/CD to update new features into our React app, so the users will always get the newest map features.

App for registering Turtles

We have added a web app for accepting new applicants for Ninja Turtles. This app allows for fast onboarding and expansion of the workforce in a gig economy style. Thus, Middle-aged Mutable Ninja Tuples can quickly become the biggest provider of Personal Safety as a Service, benefiting from the accompanying network effects.

The Blazor app is automatically deployed to an Azure App Service when committing to main, using a GitHub Action. It’s available here: https://mamntservice.azurewebsites.net/ 

After registering, the user should quickly be able to log in to the Dynamics mobile app. In order to make this possible, a lot of things need to happen behind the scenes.

The first step is automatic creation of an Azure AD user, and assigning of a Dynamics license. We created a custom Azure API client for this, which is called from the backend of the Blazor app. After that, the only thing missing is a Dynamics license. But first, the user must be synced to Dynamics from Azure AD, which can take up to an hour.

Because of this delay, we aren’t available to programmatically add a Dynamics license right away, so we created a Dynamics plug-in which automatically adds the license when a user is created. After it has run, the user should be able to log in to the Dynamics mobile app:

Note: it’s possible to force the user sync to happen right away using PowerShell, we’ll look into that as a possible improvement.

Feel The Heat

Dispatchers have a new tool at their disposal; a Power BI report that visualizes reported distress calls in a heatmap. This is achieved by pulling data using Azure Synapse Link to Dynamics 365, which is then used as a dataset for the Power BI report. For MaMNT, both Synapse and Power BI were uncharted waters before development began, and have proven to be just the tools we needed to bring some extra oomph to the user interface.The heatmap itself is a prebuilt feature by AppSource user Weiwei Cui that takes our latitude and longitude parameters as input and allows us to customize the clustering, values and the look and feel of the map. 

The heatmap dots warp in shape as you zoom on the map, in order to scale the dots and heat signatures, which produces an awesome-looking effect when the dots are split and merged. Going forward, the heatmap will be limited to a set number of the most recent calls, and we may add a timelapse effect to show patterns and development in crimes committed in the city.

For dispatchers, we also added a filtering feature to the right-hand side where the different types of distress calls can be selected to filter the map instantly. This will enable the turtles to move towards proactively fighting and predicting crime instead of reacting to distress calls. This has great utility not just for improving our services for individual users, but also for providing business facing services to third party security entities (i.e. Police).

Automatic test data generation

When developing a tool to fight crime and respond to distress calls, it is imperative to be able to simulate different loads on the systems and dispatchers to build the best possible solution that fits real-life scenarios. MaMNT set up an Azure Data Factory to produce the desired effect of simulated, continuous distress calls being sent from all over the city of Oslo. The Data Factory job randomizes a caller name, a crime type and x-values of coordinates within the range of 59.9xxxx, 10.xxxxx. New distress calls pop up all over the city at set intervals, and you can see the heatmap updating with a new batch of distress calls every 15 minutes. 

Bombshells Day 2

Fremgang er stikkordet når Bombshells raser i gang med dag 2. Gjennom dagen har vi lagt inn mange claims for nye badges.

Excellent User Experience

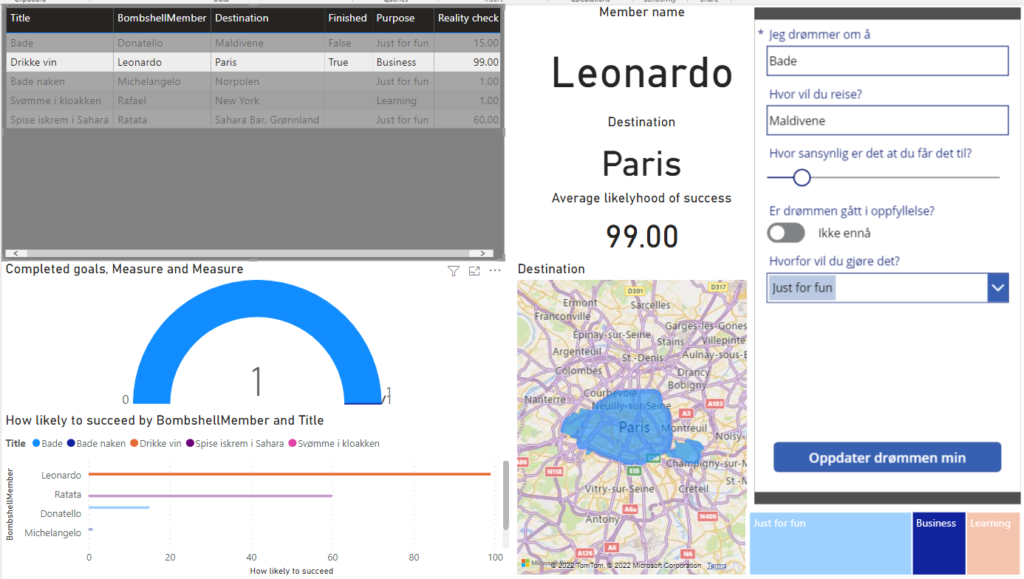
Data er oljen i vår løsning. Første dag gikk i stor grad til å samle inn data fra sensorene, behandle og flytte disse dataene inn i Dataverse. Siden prosessen med å få mengder av data har laget jobbet med å fremstille alternative data visuelt både gjennom rapporter, apper og andre flater. Bombshells har som et sosialt tiltak en bucketlist med drømmer som de ønsker skal bli virkelighet. Sammen med disse har de lagt til litt ekstra informasjon som kategoriserer punktene på listen, viser sannsynlighet for at de går i oppfyllelse osv.

Power BI

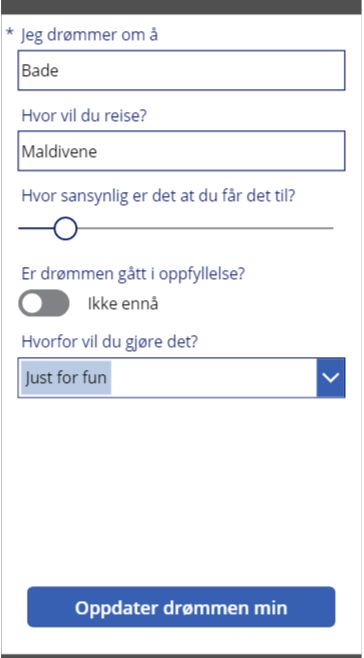
Med kanskje tidenes styggeste layout har Donatello fremstilt en rapport i PowerBI hvor han forsøker å vise detaljer rundt punktene på listen. Som del av denne rapporten har han lagt inn en enkel canvas-app som laster inn valgt rad fra tabellen og lar brukeren gjøre endringer i sin drøm.

Visually appealing and an engaging experience surpassing expectations of simplicity, attractiveness and a look that just speaks of blings.

Most Extreme Business Value in Real World Scenarios

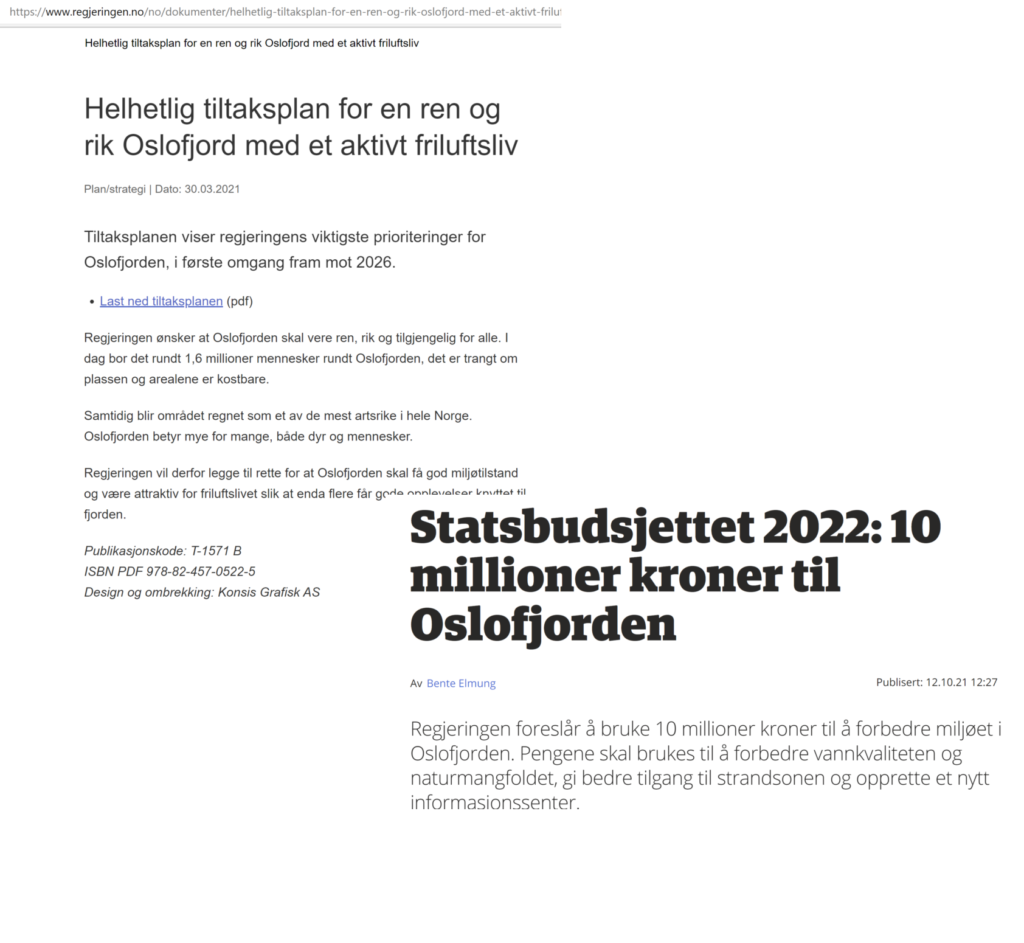
Vi ønsker med vår teknologi å “Tenke globalthandle lokalt”. Slagordet stammer fra den gangen Gro Harlem Brundtland deltok i det store verdensmøtet om klima og miljø. Slagordet står den dag i dag. Sammen med 1.6 millioner mennesker bor alle på team Skill bombshell rundt Oslofjorden. Oslofjorden er i en elendig tilstand der alt liv snart er borte. Vi ønsker derfor i dette hackatonnet å å lage en prototyp som simmulerer miljøovervåking av Oslofjorden. Når det oppstår en hendelse av uønsket karakter skal innbyggere blir varslet via SMS mens de som kan komme å ordne opp blir varslet på flere kanaler som SMS og teams varsler.

Best pris på Nokia 3210 Mobiltelefoner - Sammenlign priser hos Prisjakt

Vi benytter det siste innen teknologi som sensorer, maskinlæring. Vi henter i data fra eksterne kilder som høyvann og lavvann for å kunne utføre bedre predikeringer av hva utslipp kan medføre. Alle tjenester er i Microsoft azure og rulles automatisk via CI/CD av kode og infrastruktur. Prototyåen skal derfor kunne rulles ut enkelt til andre lokasjoner i verden.  

Vi mener derfor at vår løsning har en ekstrem forteningsverdi for samfunnet lokalt, men også på sikt globalt. Selv om det antagligvs finnes øknomiske modeller for hva liv i oslofjorden er verdt i kroner og øre, mener vi at dette er uerstattelig. Gjennom innovasjonnorge og private aktører vil vi påsta at det er det penger til å fortsette prosjektet etter endt hackaton.

Rock Solid Geeknes

Sensorene vi benytter som en protyp skal kunne erstattes med real word sensorer som er beregnet for hav. Det vi her ønsker å teste er en flyt fra ende til ende. Det Rock Solid Geeknes vi holder på med er sensorene. Sensorene sender verdier til Azure Eventhub. Videre har vi satt opp maskinlæring som predikerer samt varsler om uønskede hendelser pr SMS (for befolkning) eller via SMS og Teams (for de som skal ut å redde Oslofjorden)

Vi har gått over fra noen ikke 100% vellykkede forsøk på å få sensorriggen opp på interwebz via wifi, til å sikre at vi kan bruke et mellomledd til å for at vi kan fange dataene over på en maskin som så fører dataene til sin endelige destinasjon. Der kan de bli håndtert som nødvendig.

Vi har i løpet dagen trent ai-modeller på både pizza og skilpadder. Den endelige konklusjonen er at de to ikke bør blandes (pizzaen blir litt ulækker).

Når vi populerte med data fikk også en liten utilsiktet bonus E2E test på flyten av data inn i eventhub og hele veien ut til varslingene i teams. Vi håper at ingen turtles fikk ødelagt lunsjen sin som følge av falske alarmer.

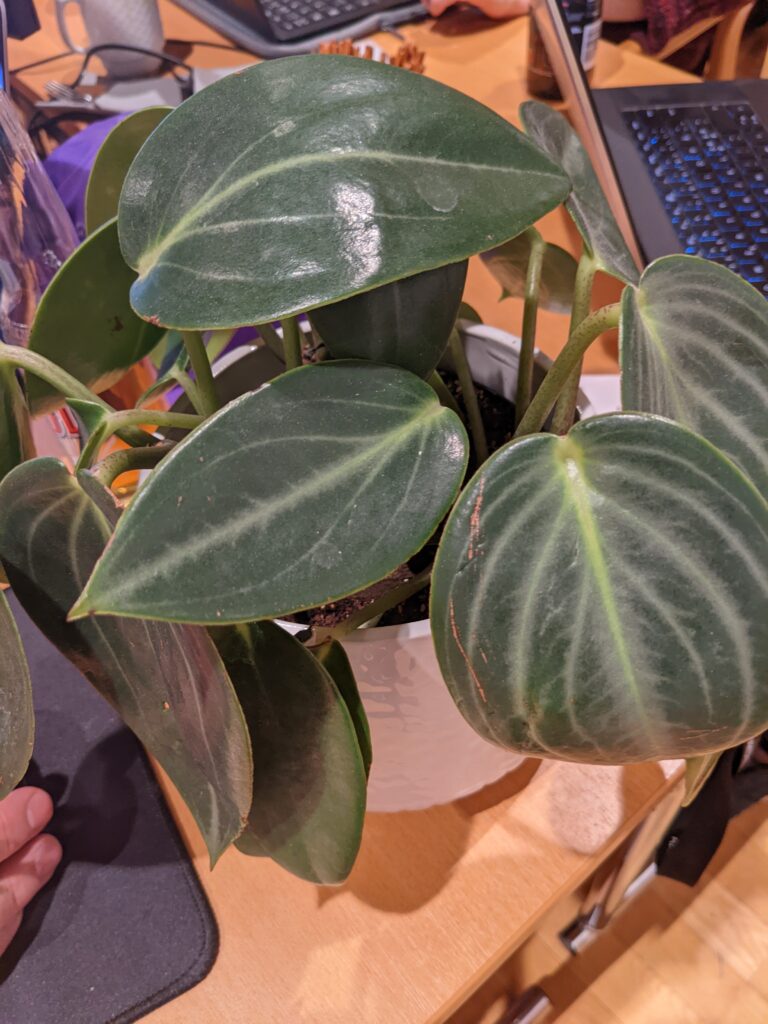
Monitorering av planten på pulten har avdekket at fuktinnholdet i jorden i potta synker med ca. 5% i løpet av en dag. Det er uklart hvor mye planten har inntatt og hvor mye som har fordampet.

Til slutt har vi geeket ut for å få flest mulig badges og jobber fortsatt med å skaffe det komplette settet (selv dooooh).

Killer App

Det er en tøff kamp å redde Oslofjorden. Det er derfor viktig at det sammles inn hva som motiverer den enkelte ansatt slik at de kan utføre en god jobb. Derfor har vi laget følgende killer-app

Som Rema 1000 sier; “Det enkle er ofte det beste!” Apper er ikke noe unntak. Donatello lever etter mottoet “if it doesn´t add any value, it doesn´t belong there. Derfor strippet han bort alle elementer som ikke hører hjemme i canvas-appen som er integrert i PowerBI. Alle elementene som skal spille inn mot appen lever i rapporten og det eneste brukeren trenger å gjøre er å endre noe og trykke “Oppdater drømmen min”. En så enkel app at den nesten tar livet av deg. Rett og slett en killer app.

Badges

Liste over badges vi har jobbet med fredag før kl 17.