With this post we claim the badges:
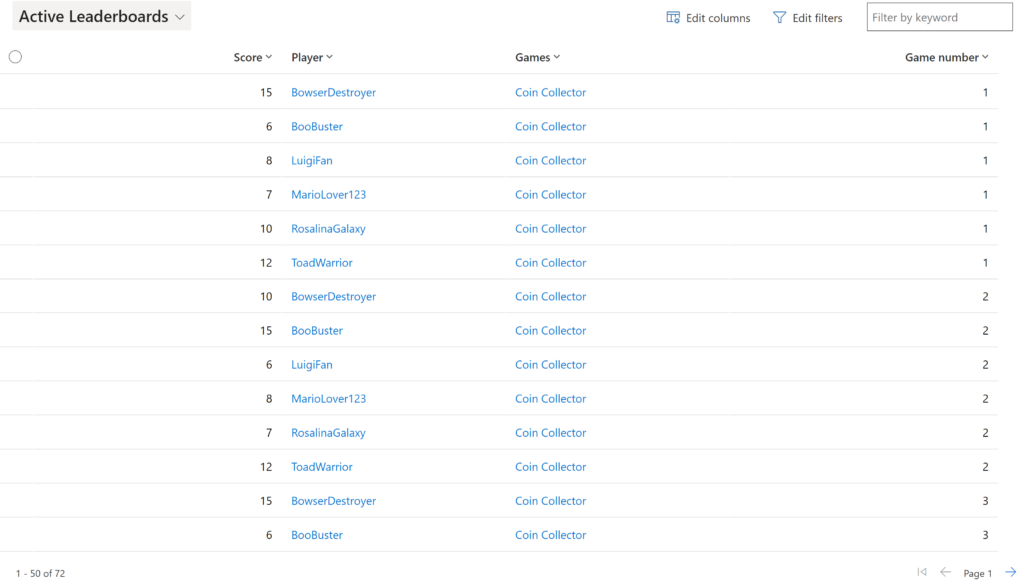
- Dataminer – for using dataverse as a datasource in Power BI, with data from the games.
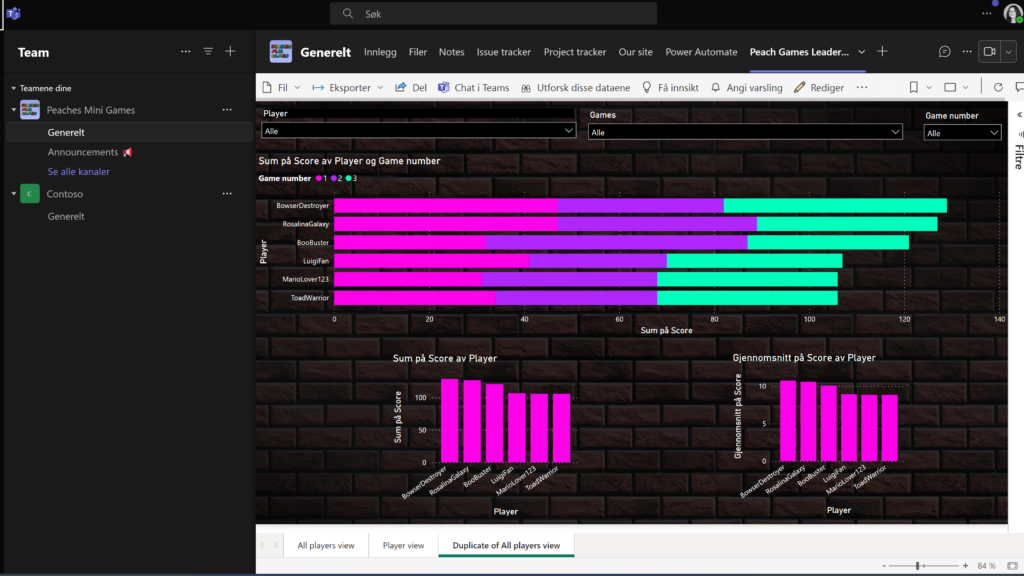
- Plug N’ Play – for embedding the Power BI report into teams.
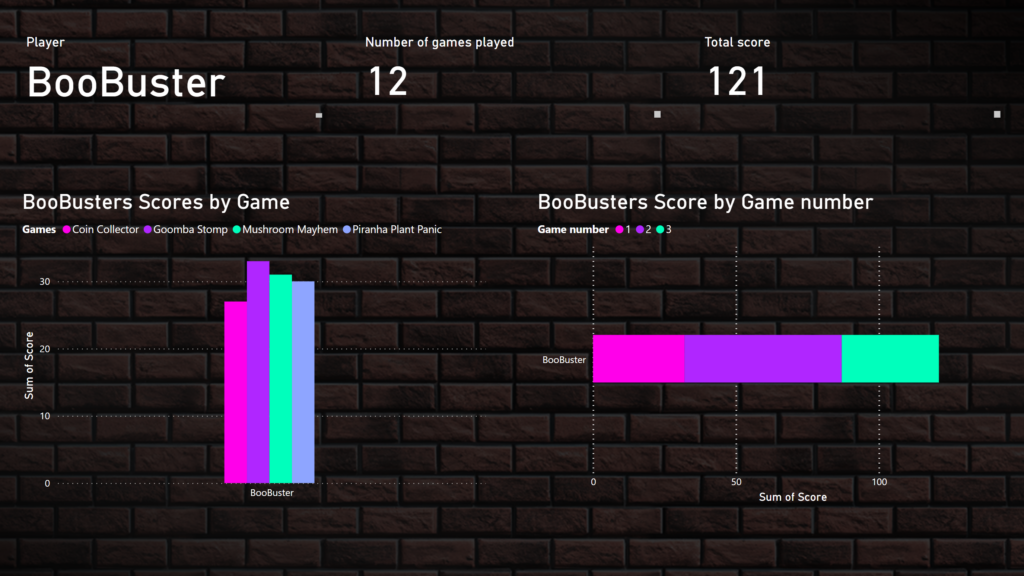
The data from the Power BI report is coming from a table in dataverse called “Leaderboards”. You have the score of each player for a certain game, and what number of try there was for that game. We then use this data in the Power BI report to show all of the players score in a dashboard. There is also the possibility of seeing one specific players data. Which is of course presented in the same graphical theme as the other apps.


And of course it doesn’t stop there. We then also made sure to embed the Power BI report into Teams. Into our Peaches-team where we can then keep track of the players progress. The report addresses a crucial business need by allowing us to efficiently track and analyze the progress of players in the various games. We can then make data-driven decisions, like seeing which game the kids find more fun and entertaining. This can then be used to further develop games for the kids, and enhance their learning experience. Which will allow us to constantly evolve and improve.


Dataminer: How are you mining/processing your own data from Dataverse? Showing the data directly or as simple aggregate is not enough.