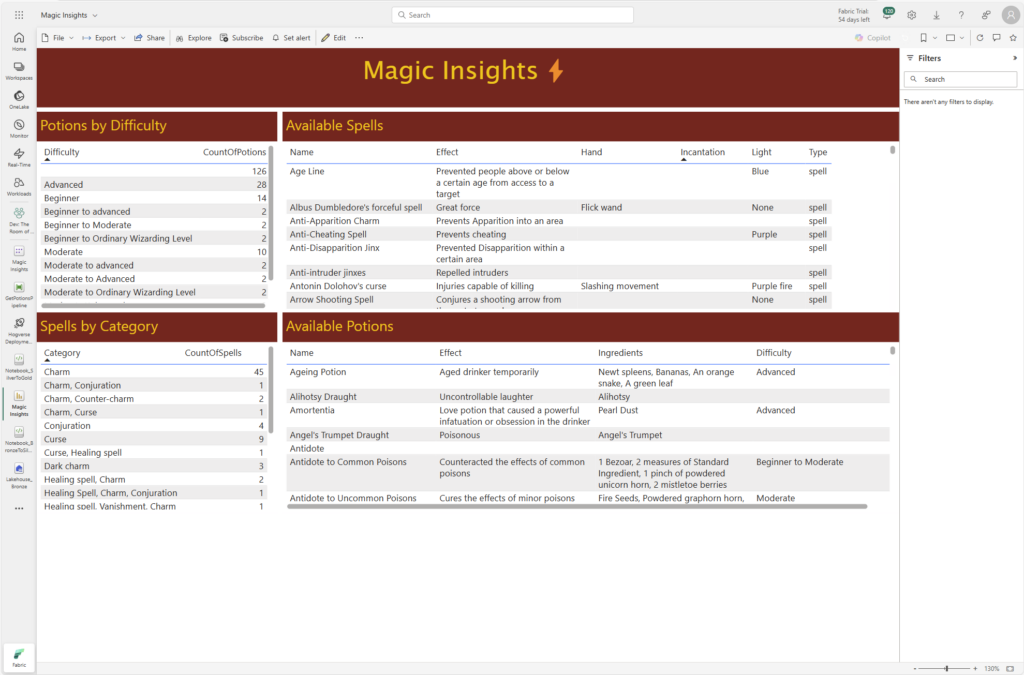
“It’s EVIDIosa, not Leviosaaaa” a contribution to the delivery for the Fabric Fera Verto category. Here we explain our Fabric set up in for this category.
Workspaces
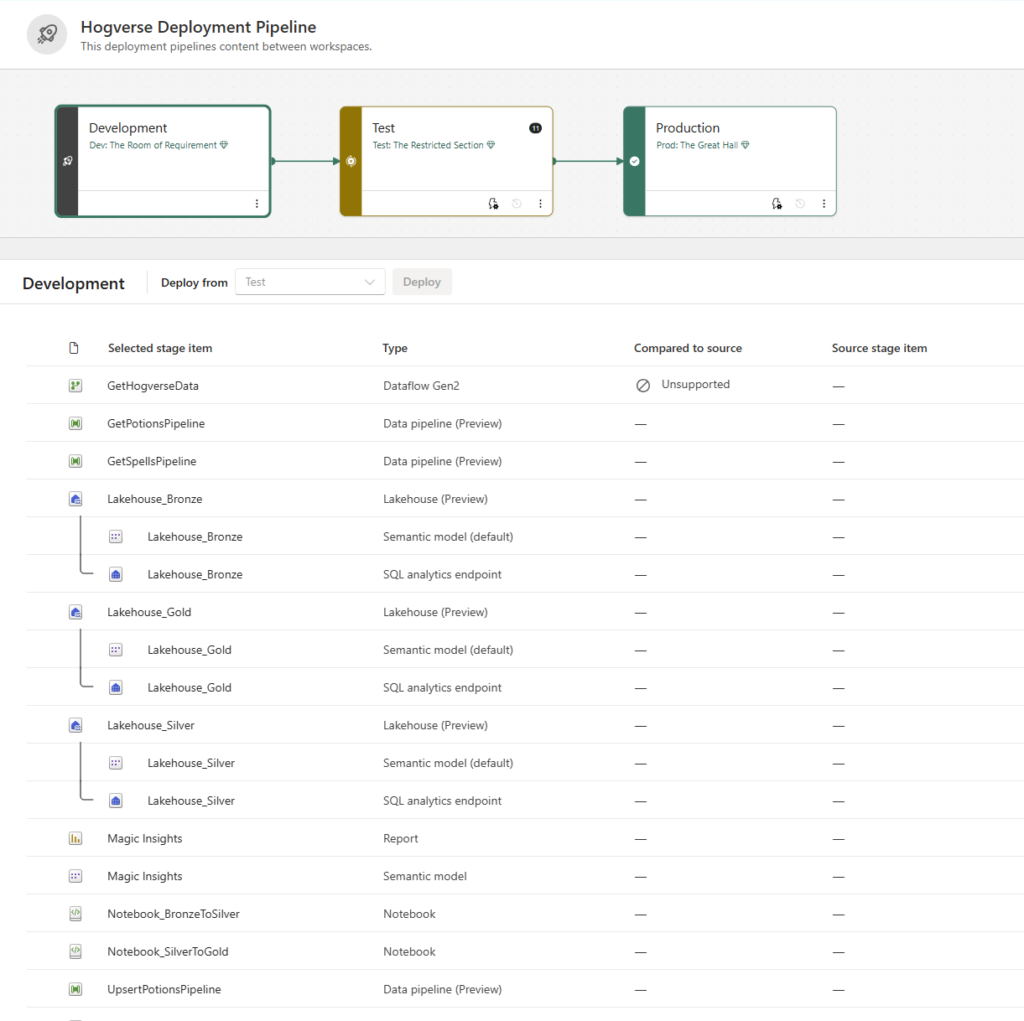
We are using three workspaces. Dev for development, test for UAT testing and prod for production.
- Dev: The Room of Requirement
- Prod: The Great Hall
- Test: The Restricted Section
Deployment Pipelines
We have implemented deployment pipelines for deploying changes between workspaces so that the reports can be tested and verified before going into production.
Hogverse Deployment Pipelines for deploying items between workspaces.
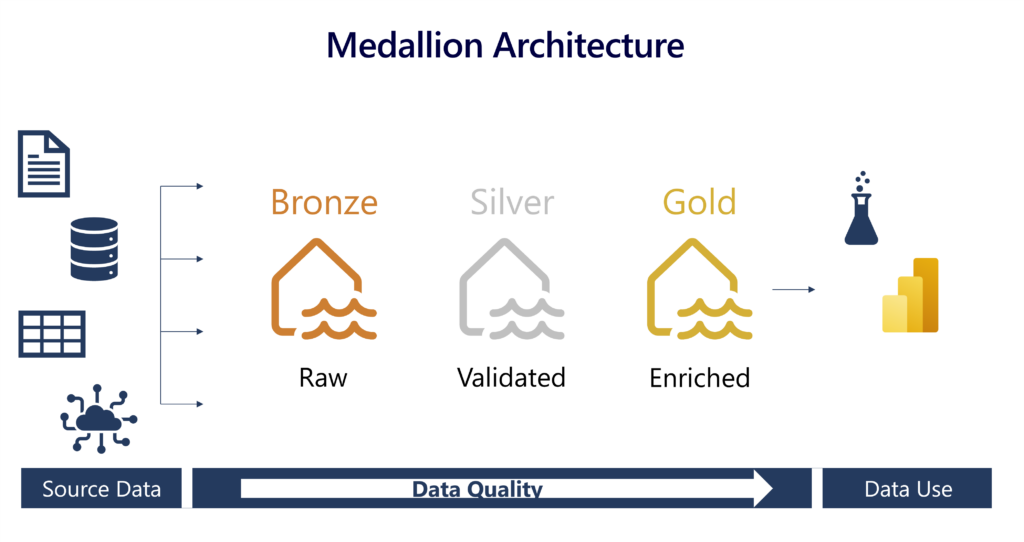
Medallion Architecture
We use the medallion architecture to organize data into three layers: Bronze (raw, unprocessed data), Silver (cleaned and enriched data), and Gold (aggregated and analytics-ready data), enabling a structured, scalable approach to data processing and analytics.
Bronze layer
The bronze or raw layer of the medallion architecture is the first layer of the lakehouse. It’s the landing zone for all data, whether it’s structured, semi-structured, or unstructured. The data is stored in its original format, and no changes are made to it.
Silver layer
The silver or validated layer is the second layer of the lakehouse. It’s where you’ll validate and refine your data. Typical activities in the silver layer include combining and merging data and enforcing data validation rules like removing nulls and deduplicating. The silver layer can be thought of as a central repository across an organization or team, where data is stored in a consistent format and can be accessed by multiple teams. In the silver layer you’re cleaning your data enough so that everything is in one place and ready to be refined and modeled in the gold layer.
Gold layer
The gold or enriched layer is the third layer of the lakehouse. In the gold layer, data undergoes further refinement to align with specific business and analytics needs. This could involve aggregating data to a particular granularity, such as daily or hourly, or enriching it with external information.
Data ingestion
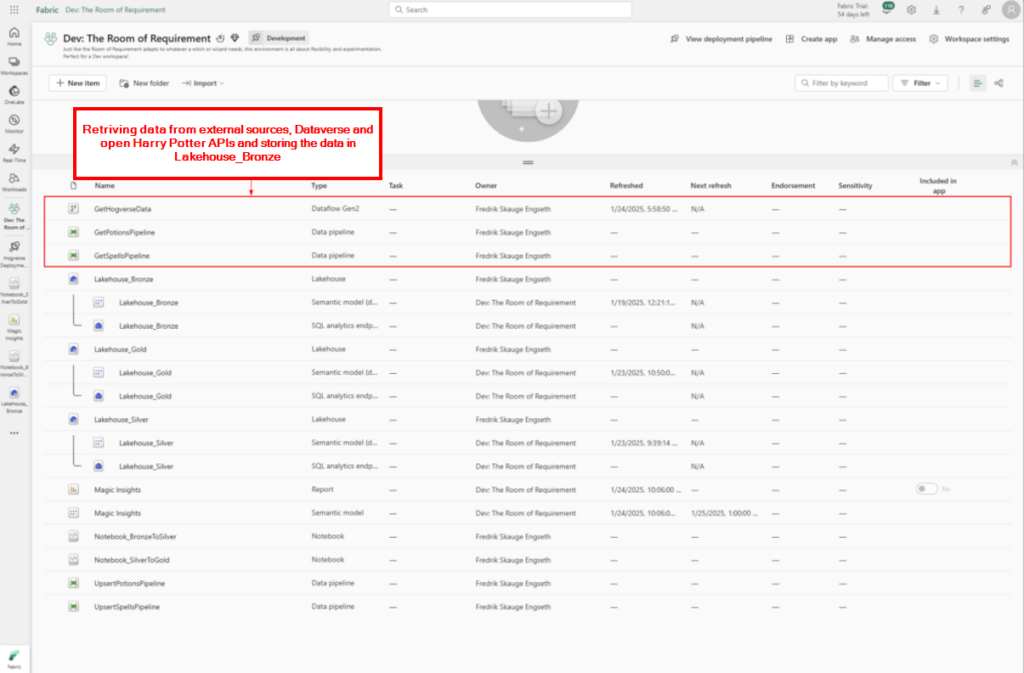
We used Data pipelines and Dataflows Gen2 for retrieving data into Fabric and store it in our bronze lakehouse. Below is a image of the items we use to ingest data into the platform.
Dataflows Gen 2
Using Dataflows Gen2 to retrive data from another dataverse tenant using a Service Principle that allows “Accounts in any organizational directory (Any Microsoft Entra ID tenant – Multitenant)” to connect. Since there was an error creating a free Fabric capacity in our CDX tenant. The data gets stored in our bronze lakehouse.
Example:
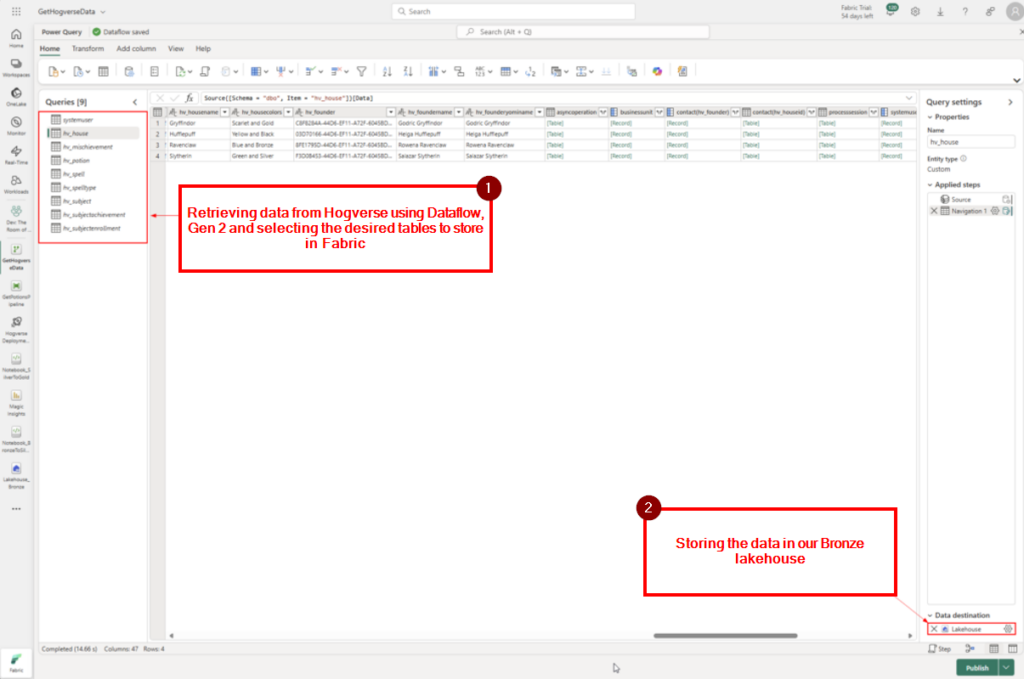
Steg 1: Retrieving data using the Dataverse connector in Dataflow Gen2.
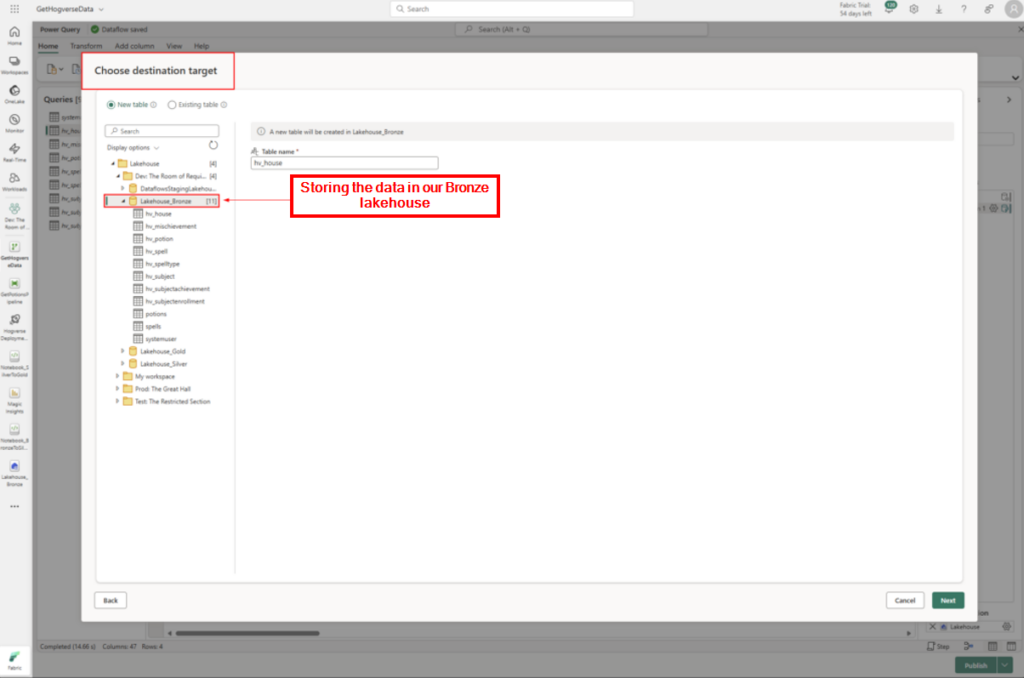
Steg 2: Storing the data in our Bronze lakehouse.
Data pipeline
Where using Data pipeline for retrieving data from open Harry Potter API’s and storing them as well in our bronze lakehouse.
Example:
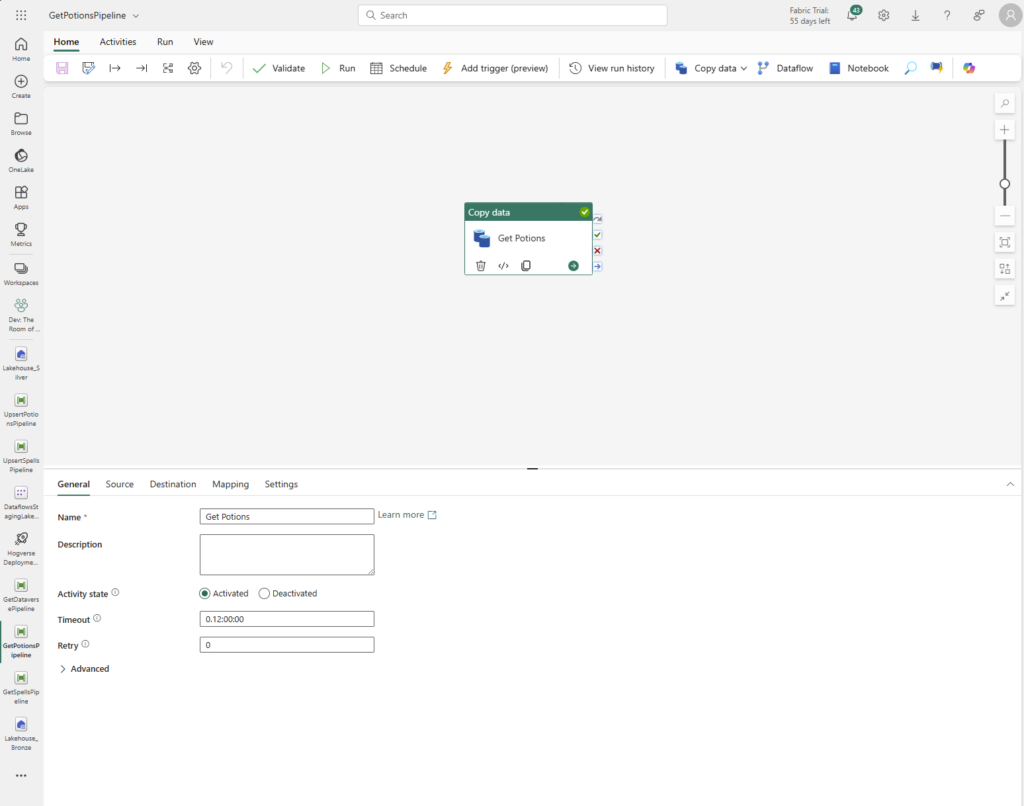
Step 1: Using a copy data step in Data Pipeline to retrieve data form external data:
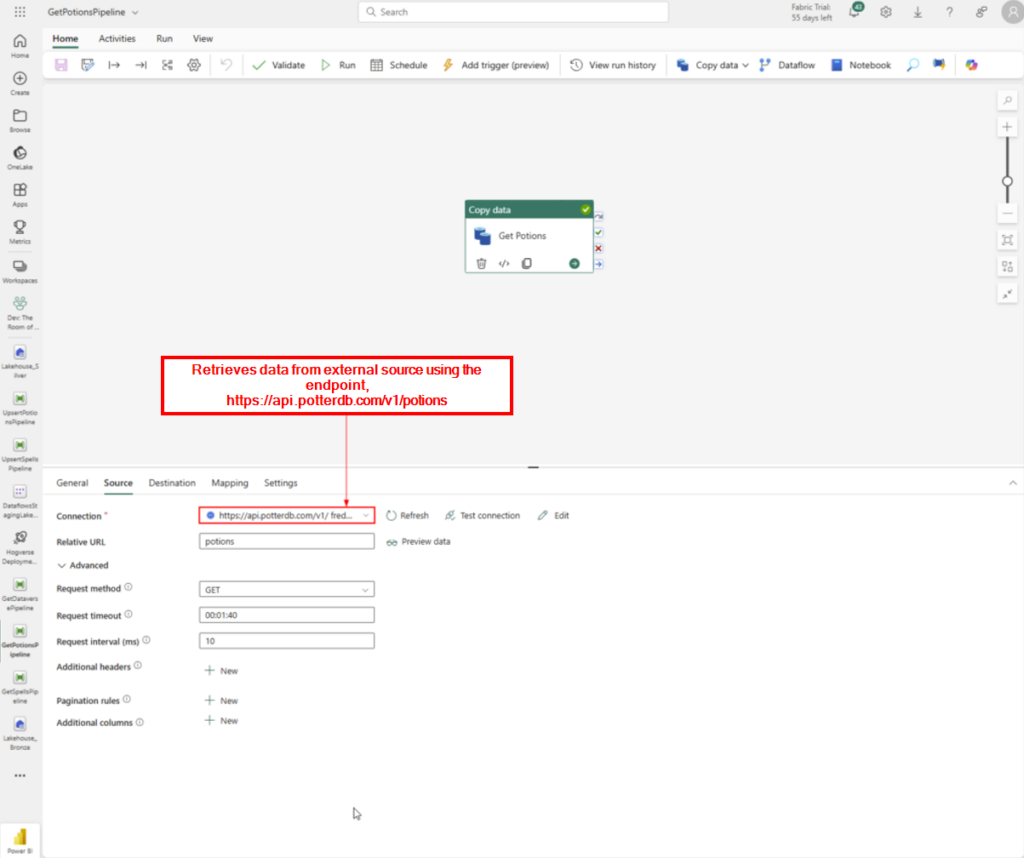
Step 2: Retrieves data from external source using the endpoint,
https://api.potterdb.com/v1/potions
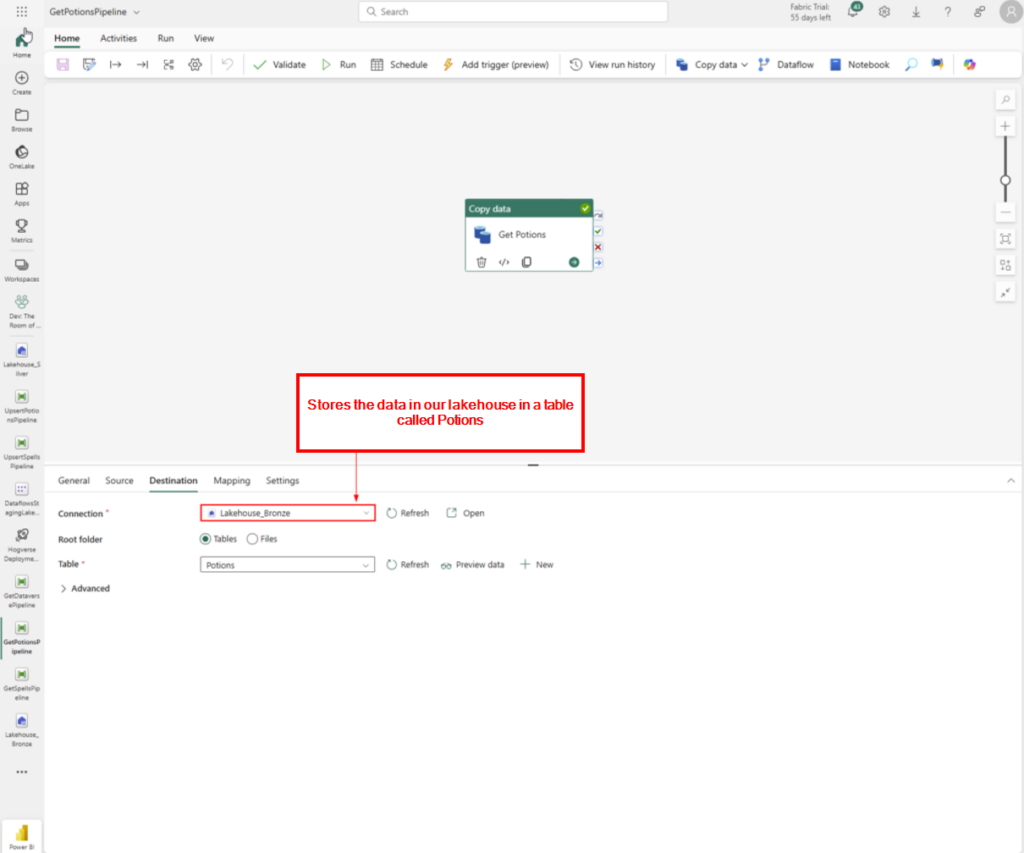
Step 3: Stores the data in our lakehouse in a table called Potions.
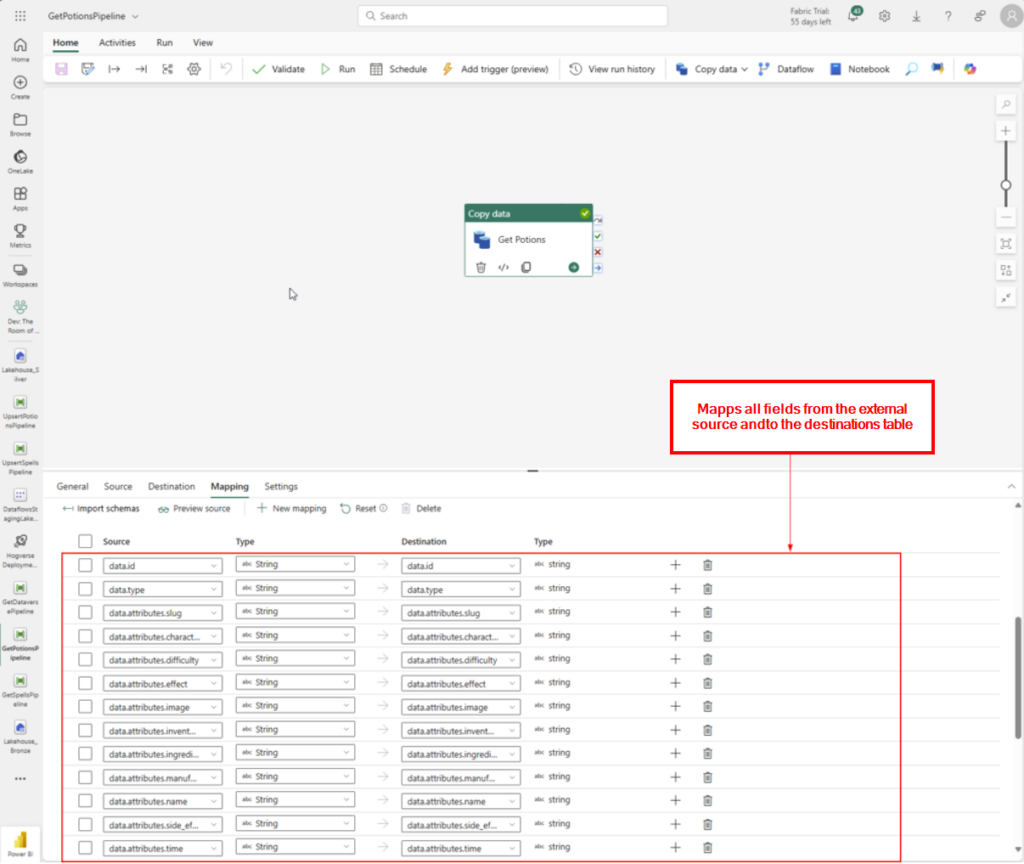
Step 4: Mapps all fields from the external source and to the destinations table.
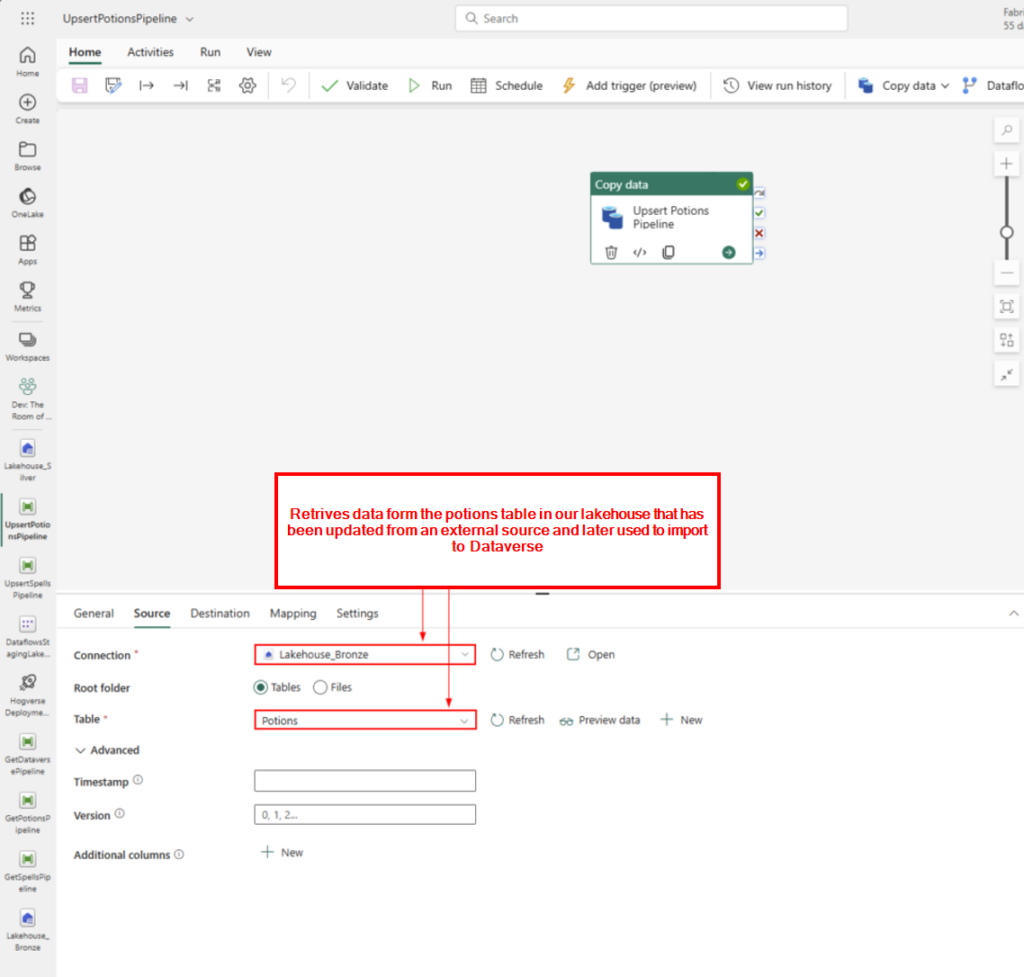
Retrives data from the potions table in our lakehouse that has been updated from an external source and later used to import to Dataverse.
Medallion implementation
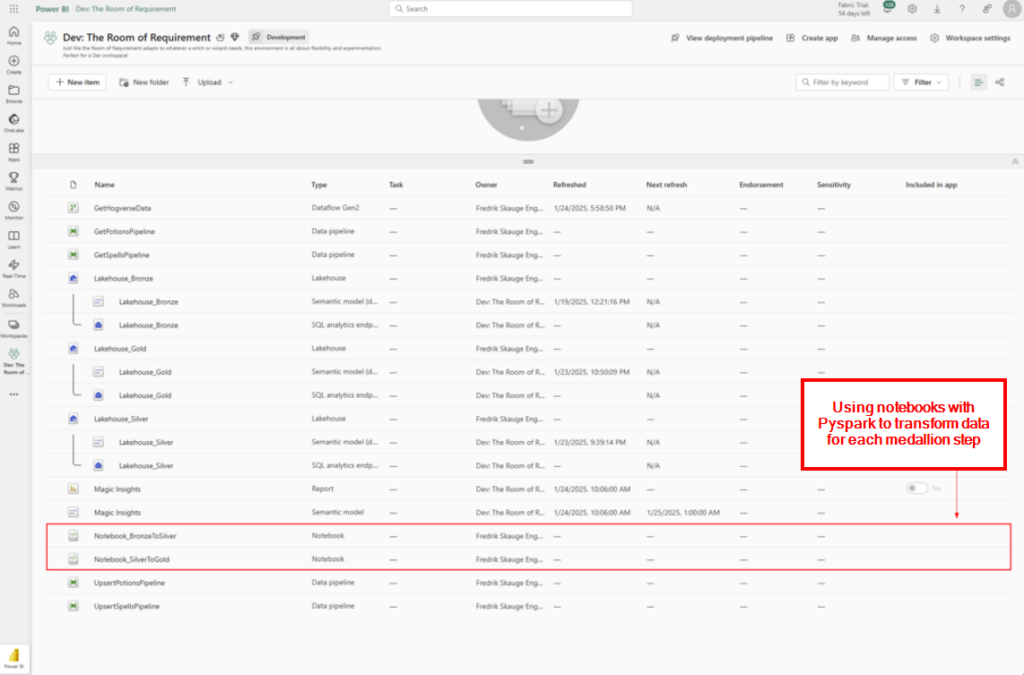
We are using Notebooks and Pyspark to implement the data transformation between the medallions. Below we go through some examples for each layer.
Bronze layer
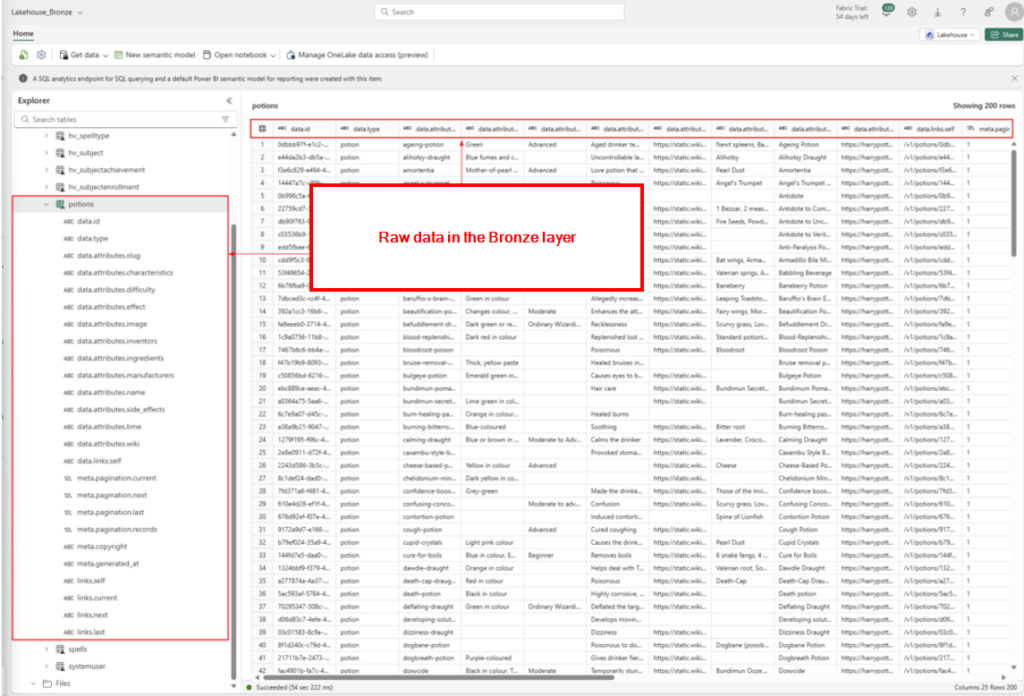
The bronze layer consist of raw data. This is data imported “as is” without any transformation. In the image below we can see how the data retrieved from the Harry Potter API looks without any transformation.👇
Silver layer
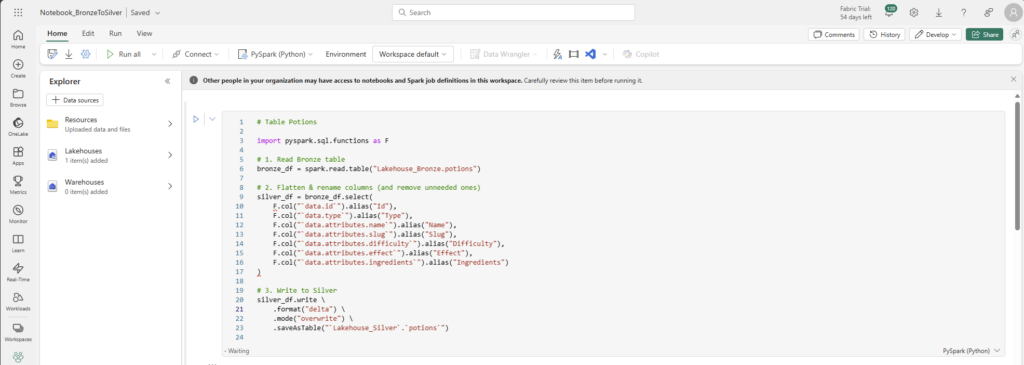
In the silver layer, we are removing and renaming columns and a cleaner table in the Silver Lakehouse. Below is the code for transforming the Potions table from the bronze layer in the picture above. The rest of the tables are using the same structure to transform the columns and data.
# Table Potions

import pyspark.sql.functions as F

# 1. Read Bronze table
bronze_df = spark.read.table("Lakehouse_Bronze.potions")

# 2. Flatten & rename columns (and remove unneeded ones)
silver_df = bronze_df.select(
    F.col("`data.id`").alias("Id"),
    F.col("`data.type`").alias("Type"),
    F.col("`data.attributes.name`").alias("Name"),
    F.col("`data.attributes.slug`").alias("Slug"),
    F.col("`data.attributes.difficulty`").alias("Difficulty"),
    F.col("`data.attributes.effect`").alias("Effect"),
    F.col("`data.attributes.ingredients`").alias("Ingredients")
)

# 3. Write to Silver
silver_df.write \
    .format("delta") \
    .mode("overwrite") \
    .saveAsTable("`Lakehouse_Silver`.`potions`")
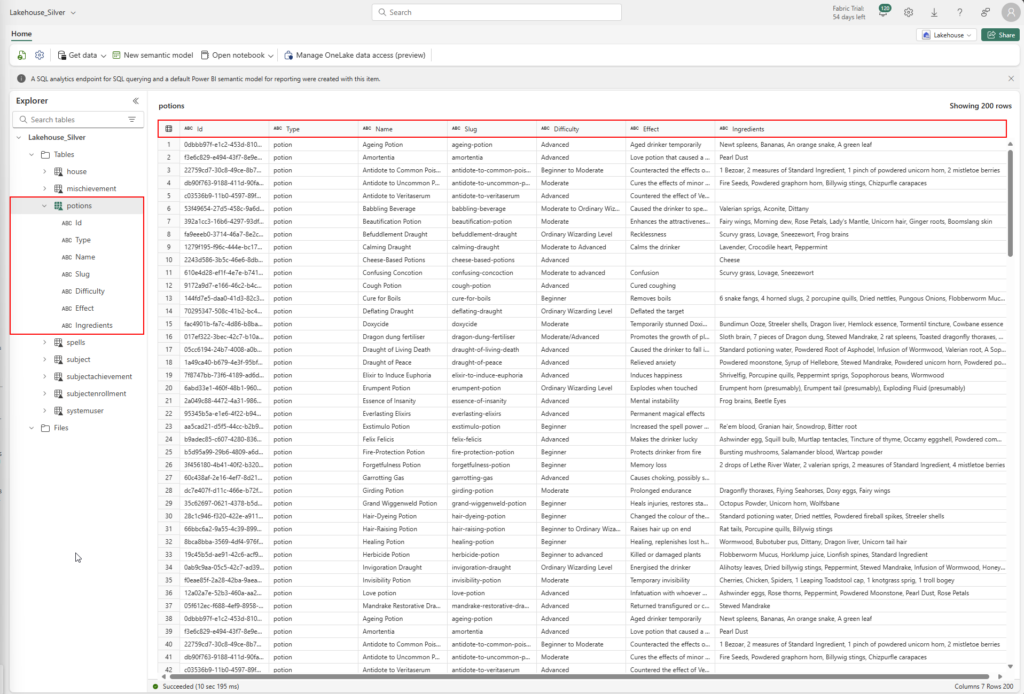
After the transformation the Silver Lakehouse and the Potion table looks like this👇
Gold layer
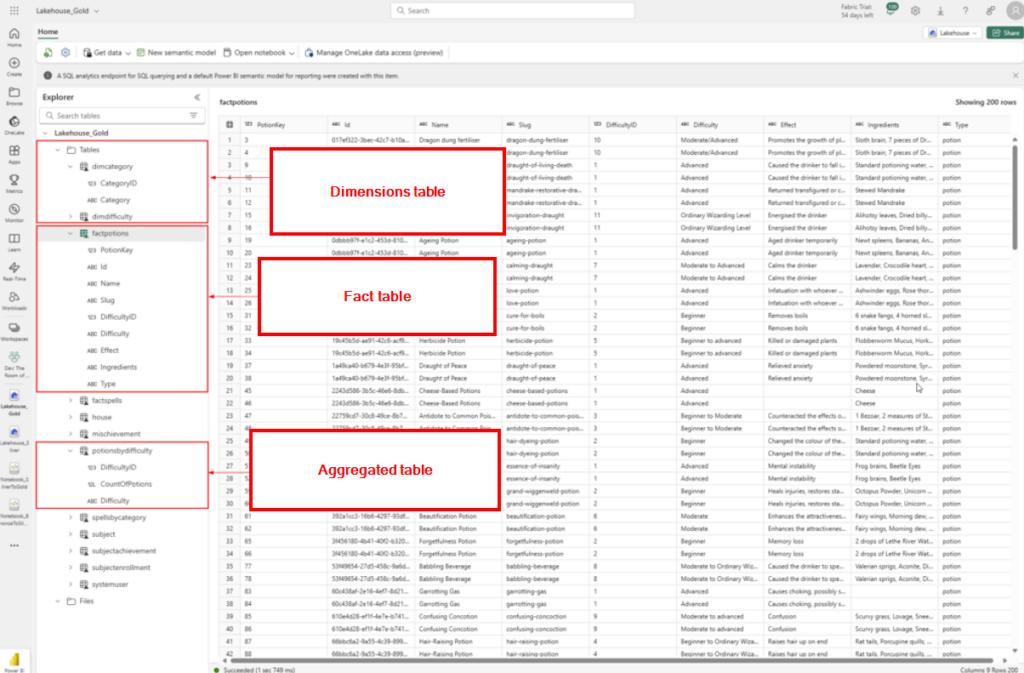
In the gold layer we are creating dimention tables, fact tables and aggregated data.
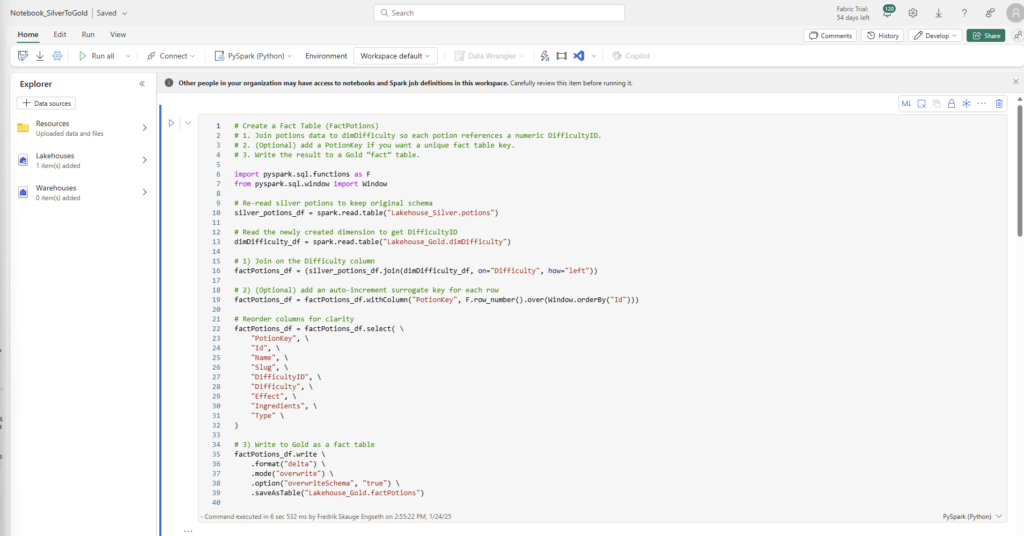
Below is an image of the code for creating the fact table for the Potions table as seen in previous examples:
Fact Table
# Create a Fact Table (FactPotions)
# 1. Join potions data to dimDifficulty so each potion references a numeric DifficultyID.
# 2. (Optional) add a PotionKey if you want a unique fact table key.
# 3. Write the result to a Gold “fact” table.

import pyspark.sql.functions as F
from pyspark.sql.window import Window

# Re-read silver potions to keep original schema
silver_potions_df = spark.read.table("Lakehouse_Silver.potions")

# Read the newly created dimension to get DifficultyID
dimDifficulty_df = spark.read.table("Lakehouse_Gold.dimDifficulty")

# 1) Join on the Difficulty column
factPotions_df = (silver_potions_df.join(dimDifficulty_df, on="Difficulty", how="left"))

# 2) (Optional) add an auto-increment surrogate key for each row
factPotions_df = factPotions_df.withColumn("PotionKey", F.row_number().over(Window.orderBy("Id")))

# Reorder columns for clarity
factPotions_df = factPotions_df.select( \
    "PotionKey", \
    "Id", \
    "Name", \
    "Slug", \
    "DifficultyID", \
    "Difficulty", \
    "Effect", \
    "Ingredients", \
    "Type" \
)

# 3) Write to Gold as a fact table
factPotions_df.write \
    .format("delta") \
    .mode("overwrite") \
    .option("overwriteSchema", "true") \
    .saveAsTable("Lakehouse_Gold.factPotions")
Aggregated Table
# Aggregated Summary Table

import pyspark.sql.functions as F
from pyspark.sql.window import Window

# Read Silver Potions
silver_potions_df = spark.read.table("Lakehouse_Silver.potions")

agg_potions_df = factPotions_df.groupBy("DifficultyID").agg(F.count("*").alias("CountOfPotions"))

# Join to the dimension to get the difficulty name
agg_potions_df = agg_potions_df.join(dimDifficulty_df, on="DifficultyID", how="left")

# Write as a separate summary table
agg_potions_df.write \
    .format("delta") \
    .mode("overwrite") \
    .option("overwriteSchema", "true") \
    .saveAsTable("Lakehouse_Gold.potionsByDifficulty")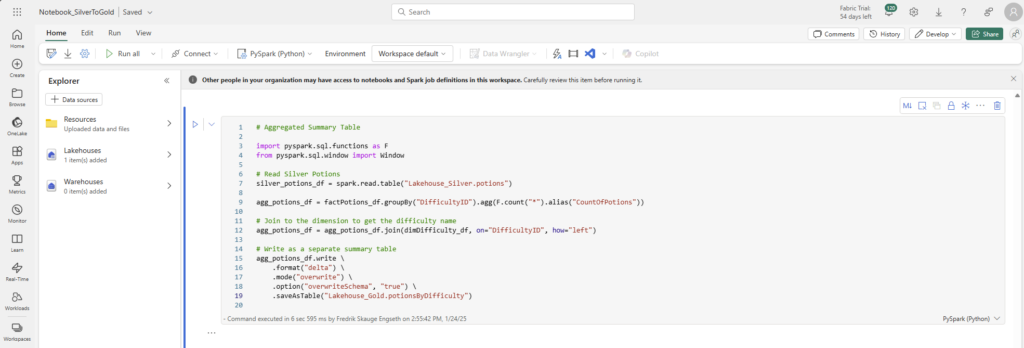
Difficulty Dimension
# Create a Difficulty Dimension (DimDifficulty)
# 1. Read the silver potions.
# 2. Extract unique difficulty values.
# 3. Assign a numeric DifficultyID.

import pyspark.sql.functions as F
from pyspark.sql.window import Window

# Read Silver Potions
silver_potions_df = spark.read.table("Lakehouse_Silver.potions")

# 1) Create a distinct list of difficulties
dimDifficulty_df = (silver_potions_df.select("Difficulty").distinct().filter(F.col("Difficulty").isNotNull()))

# 2) Generate a numeric key (DifficultyID) using row_number
windowSpec = Window.orderBy("Difficulty")
dimDifficulty_df = dimDifficulty_df.withColumn("DifficultyID", F.row_number().over(windowSpec))

# 3) Reorder columns so the ID is first
dimDifficulty_df = dimDifficulty_df.select("DifficultyID", "Difficulty")

# 4) Write to Gold dimension table
dimDifficulty_df.write \
    .format("delta") \
    .mode("overwrite") \
    .option("overwriteSchema", "true") \
    .saveAsTable("Lakehouse_Gold.dimDifficulty")
After the transformation we have dimension, facts and aggregated tables👇
Semantic Model
The semantic model for reporting is built on the Gold layer. The best result would be a star model, but that was not implemented fully unfurtunately.
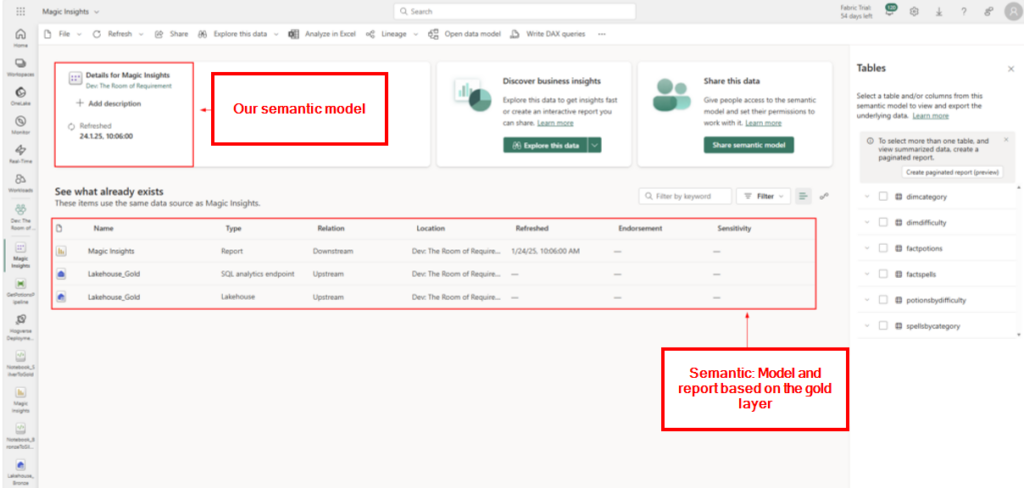
Aaand the report with the aggregated data and the transformed columns look ended up like this.
