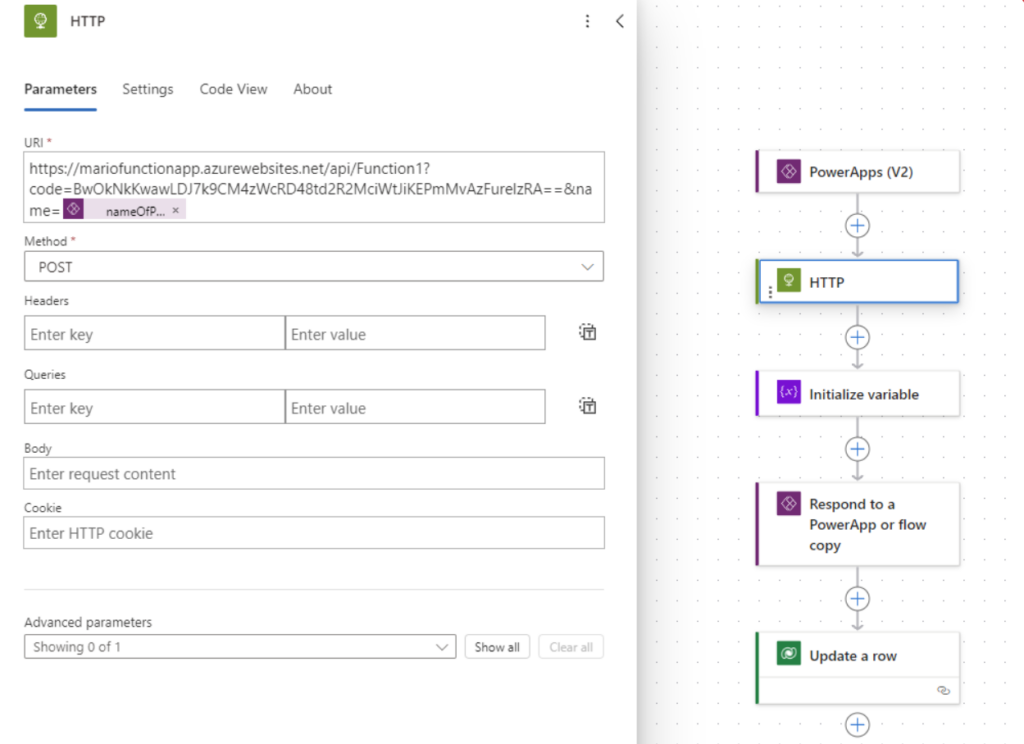
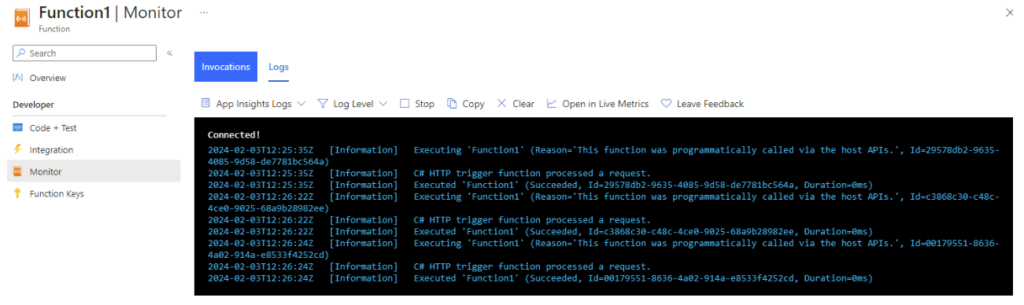
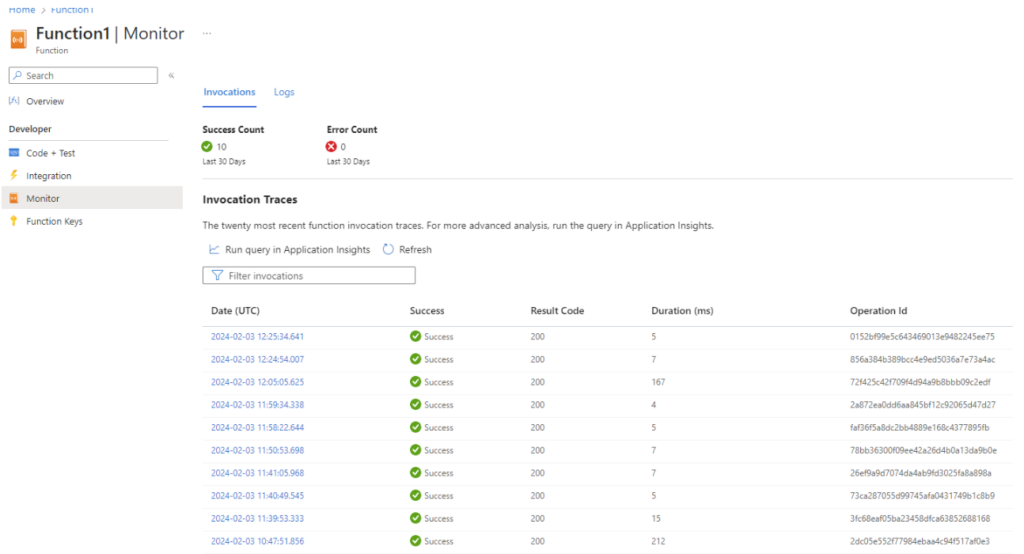
We have created a C# function app in Azure that is triggered in the power app, via a power automate flow. From the power app we send in the name of the user and write to Dataverse how many times the user has clicked the button to get help. The thought behind is that we can get KPI’s on how often the user has “cheated” or if the user is a very knowledgeable person.
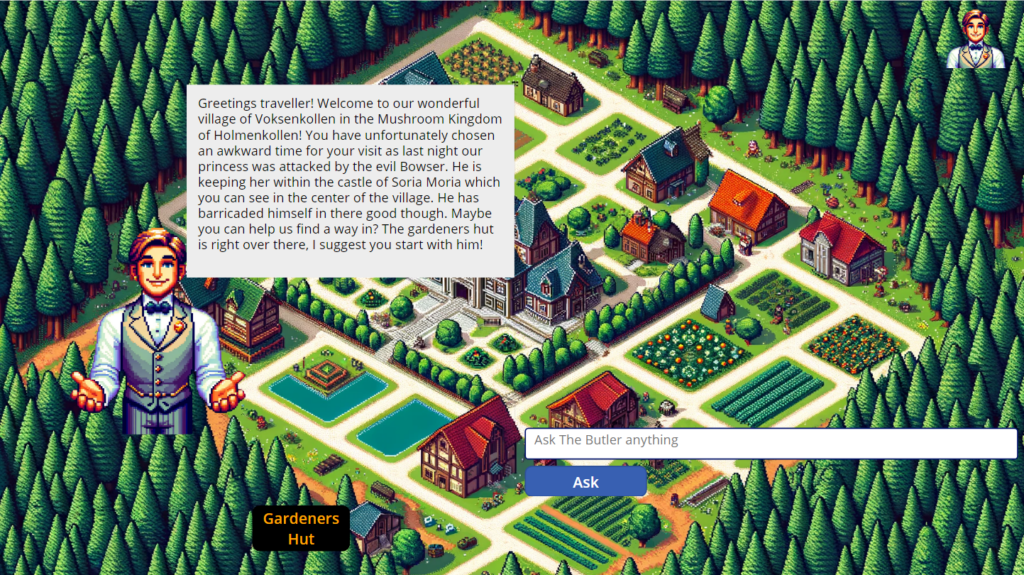
When the user pushes the picture of Toad to get help in the quiz, we send with the name of the user to power automate that triggers a Azure function app in C# that takes in the variable of the person playing:
The power automate flow then updates dataverse with one new attempt, to be used in the Power BI Dashbord and gives a notification back to the user that the cheating is noted.
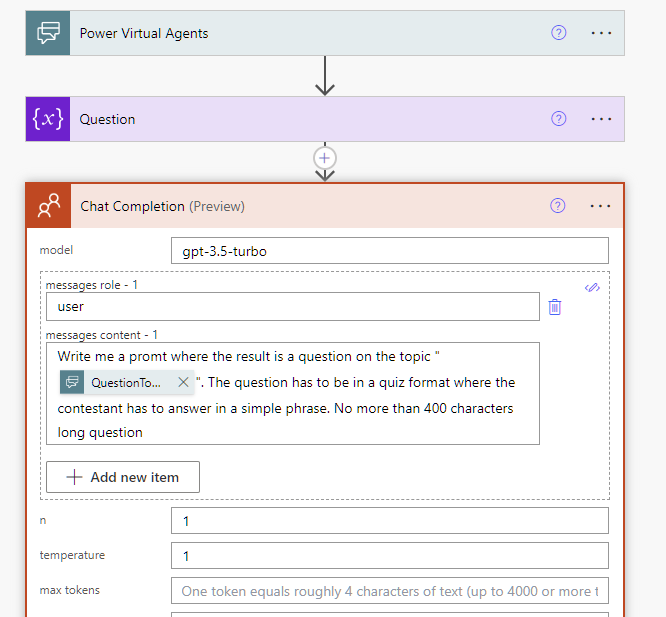
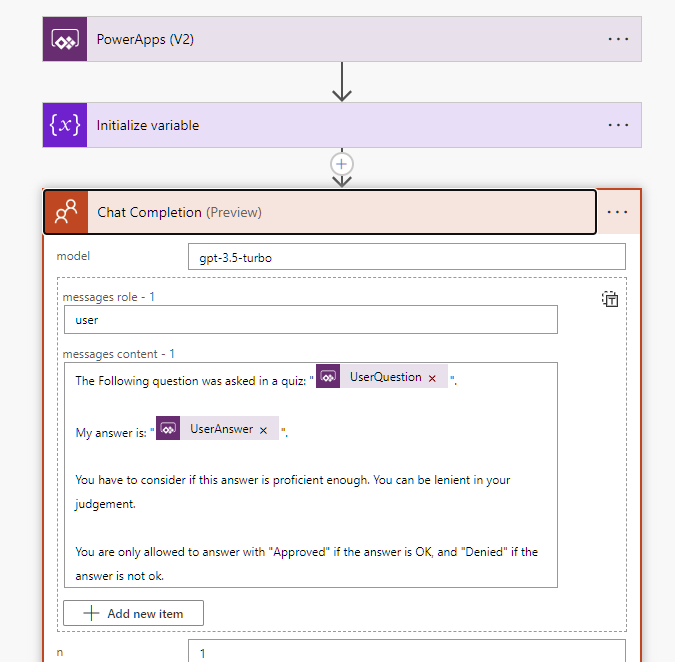
We are really deep diving into AI being at the heart of our solution. The questions for compliance training are AI generated based on topic, and the answers are matched up against the original question by AI to see if the answer provided is sufficient enough to prove that you understand the scenario.
First question is random question generated by AI:
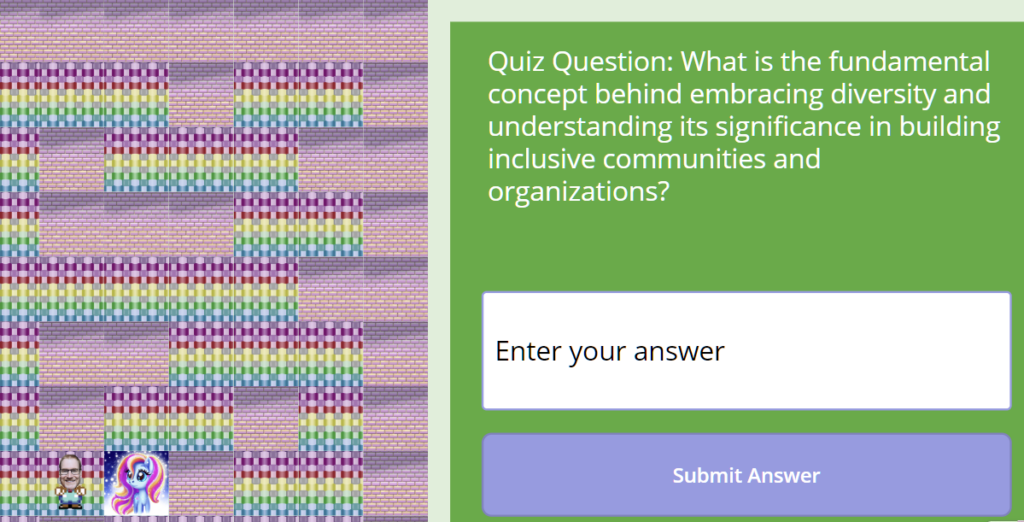
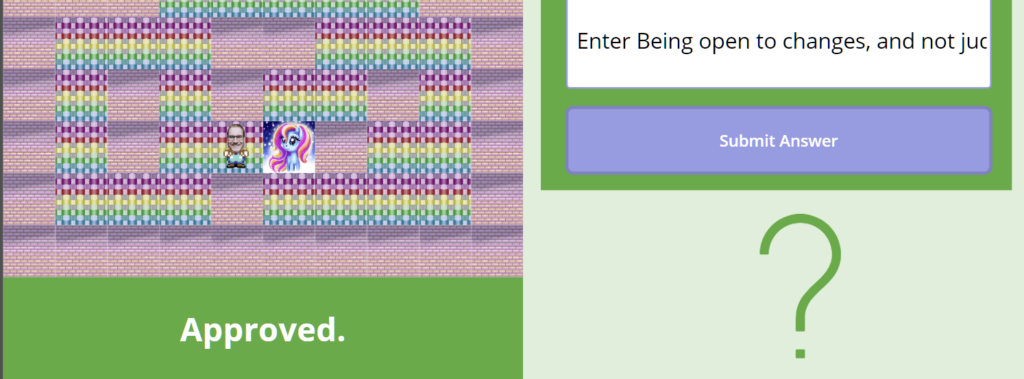
The user enters the answer
Being open to changes, and not judging people by their background. The more people with different backgrounds the organization has, the better viewpoints it is able to get
AI will then define if this answer proves that you understand what you have been reading.
In this case IA deemed the answer correct.
With AI working in clever ways we are eliminating the need for a USER to evaluate the question that is free text, and making the Q&A more advanced than the multiple choice.
Relying on AI can be a risk and it can be a problem for people creating the training. In theory this could create the whole game from scratch eliminating the need for employees to control the flow of knowledge.
What is it good that you can have improved customer communication with chatbots and forums, if the plumbers can’t get notified in realtime of relevant cases? Moreover, Mario and Luigi as CEO and CTO respectively want real-time data for improving decision support (e.g. plumber allocation) and PlumbQuest trends for further analysis.
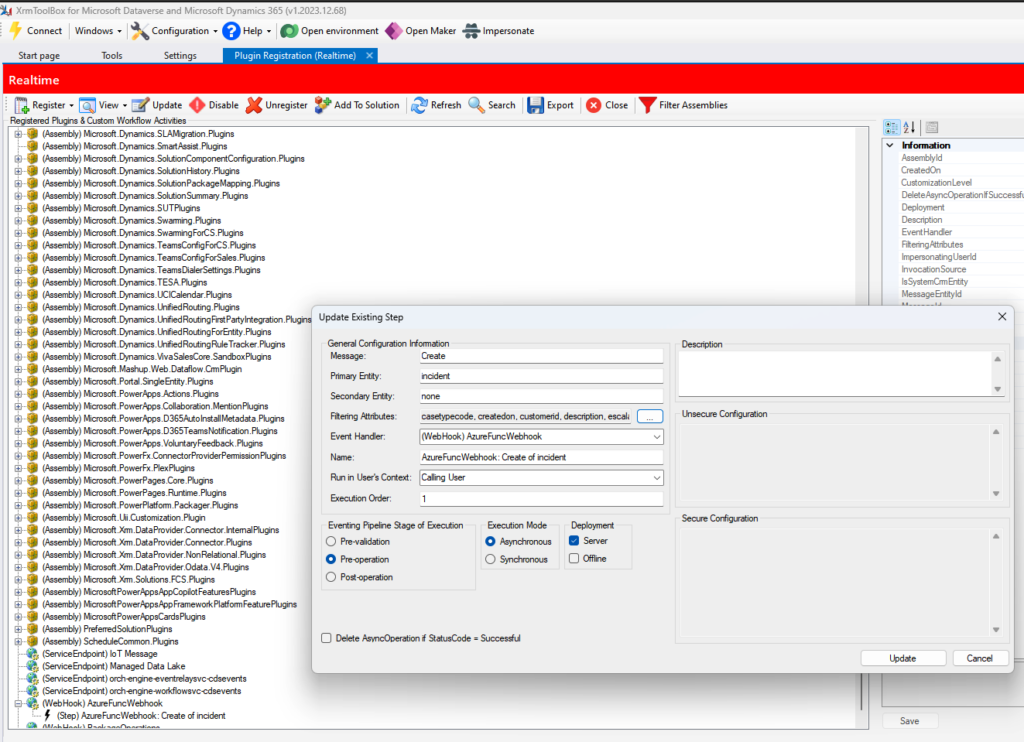
Dataverse Webhook on Incident reports
To extract real time data, we created a Web hook using the plugin tool box for Dataverse, which calls our Azure Function whenever a new PlumbQuest is made.
XRMToolbox to add a Web hook to Dataverse for real time PlumbQuest analysis
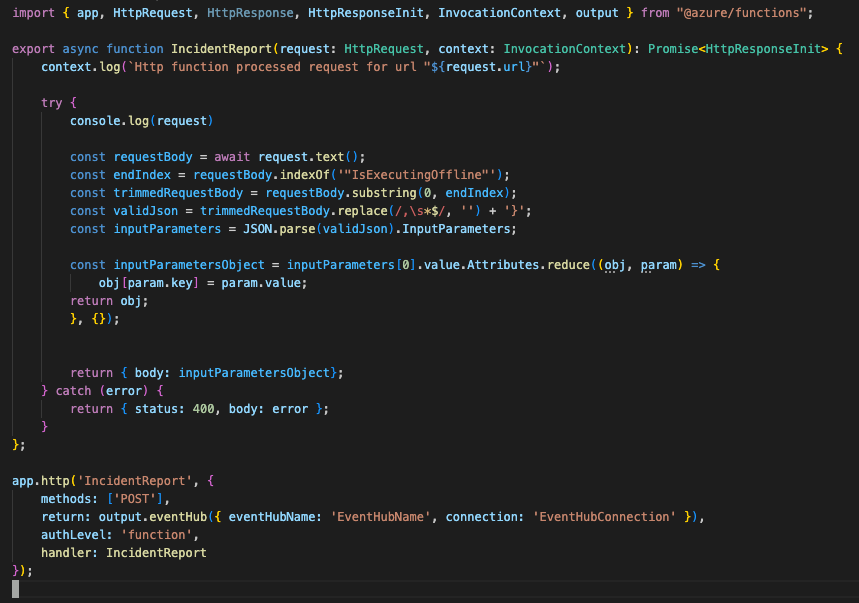
To ensure safe access, function level authentication is applied, where the toolbox allows for HTTP Query parameters, safely accessing our Function which uses a traditional HTTP-trigger:
However – Here is the hacky part. The Web hook payload is too large, which makes the traditional JSON-payload corrupted with highly dynamic lengths and content of each PlumbQuest. Therefore we had to do some custom string manipulation to extract the values of most business and de-corrupt the JSON and preparing it for analysis – Almost a Complete ETL-pipeline (*cough*)!
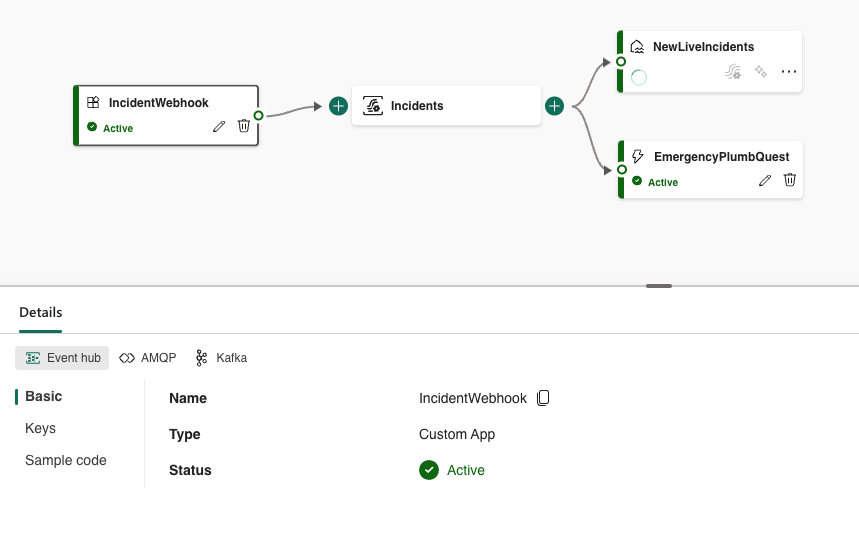
But to access this real-time data in an Analytics environment – Fabric is the way to go (as by Microsoft huge Hype-wave). We created a Custom app Source for an Event Stream in Fabric with an EventHub output binding, which then can map to many different destinations, including a Lakehouse for historisation and trend analysis, as well as Data Factory Reflexes for reactive actions in real-time.
With Data Activator’s Reflexes directly on the stream, one can e.g. trigger additional flows for highly acute PlumbQuest from members in distress, or highlight plumbers who did not provide proper service according to the PlumbQuest review.
Our Fabric Event Stream with the Custom app as Source and the Lakehouse for historisation and down-the-line processing and analysis
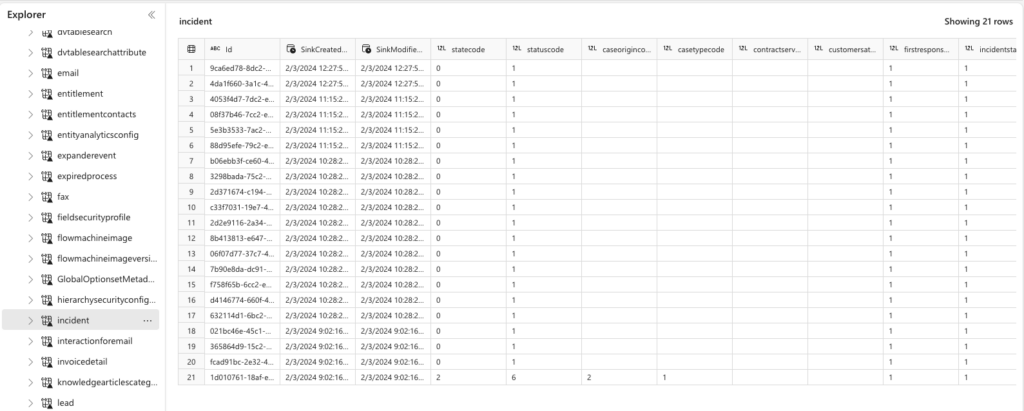
In addition, we set up a Dataverse Shortcut (Link) to Fabric, allowing for direct access to Dataverse without ETL or ingestion, providing ease of access and down-the-line deeper analysis on key business metrics, trends and community engagement.
Our PlumbQuests in Fabric Lakehouse using a Dataverse Connection for e.g. a more complete 365 customer view using Fabric items
Reproducible deployment
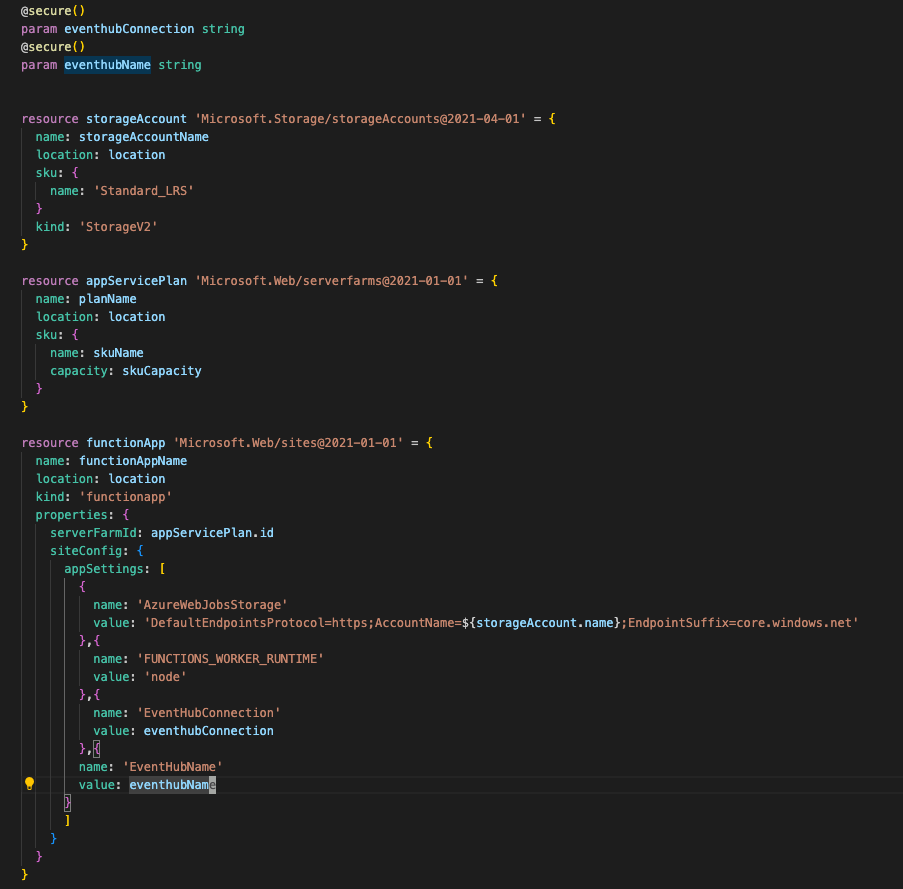
Although we are nasty hackers, we are reproducible hackers. As these were the only Azure resources used (directly), we deployed them using bicep and the Azure CLI. Sensitive variables are marked as secure and not included in the scripts, but parameterised.
The main bicep deployment definitions for our Azure Function app and related resources, the resource group naturally had a separate BICEP definition.
So if you want to do it hacky, at least make it traceable.
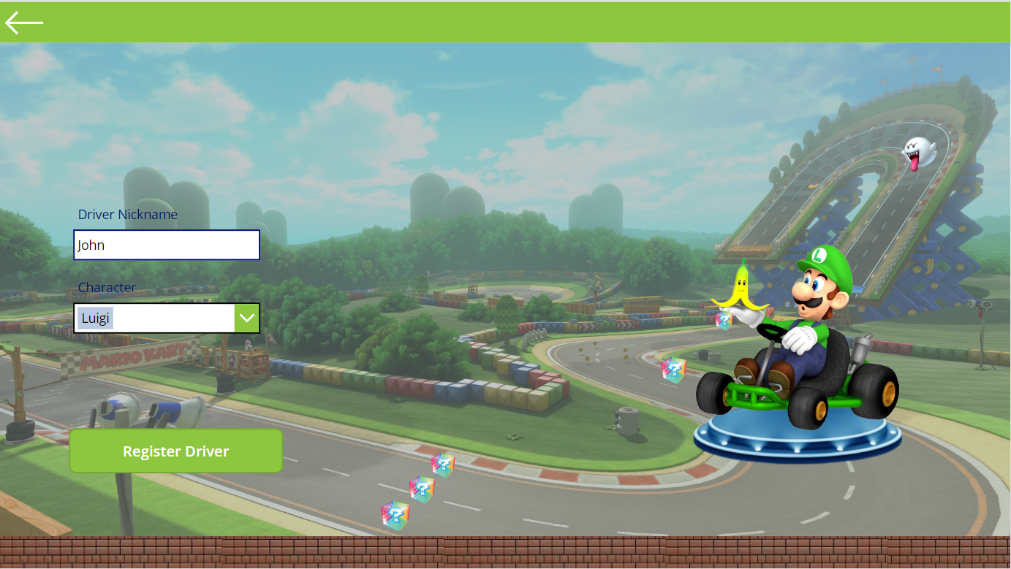
Developing an interface that is both visually stunning and functionally robust is key in app design. This post explores our journey in creating a user-friendly, shiny, and glossy interface for a Power Apps Canvas application, focused on streamlining race enrollments.
Design Approach: Sleek and Responsive
Aiming for a visually appealing and intuitive interface, we emphasized:
Shiny and Glossy Aesthetics: A design that is immediately engaging and visually appealing.
Intuitive Navigation: Ensuring ease of use for all functionalities.
App Highlights
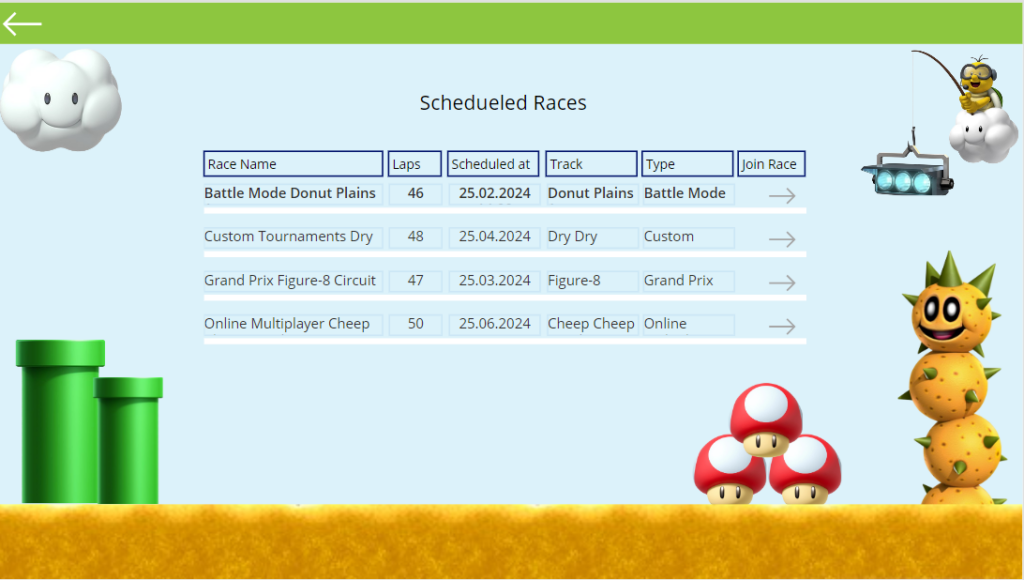
Streamlined Race Enrollments
Simplified Process: Making race sign-ups quick and hassle-free.
Interactive Elements: Engaging users with dynamic character selection features.
The application:
Conclusion
Our Power Apps Canvas project demonstrates how an attractive and responsive design can significantly enhance user interaction. By marrying a glossy aesthetic with responsive design principles, we’ve crafted an app that’s not only eye-catching but also highly functional on diverse devices.
Note: This concise draft outlines the creation of a user-friendly and responsive Power Apps Canvas application, ideal for expanding with specific technical insights or visual examples.
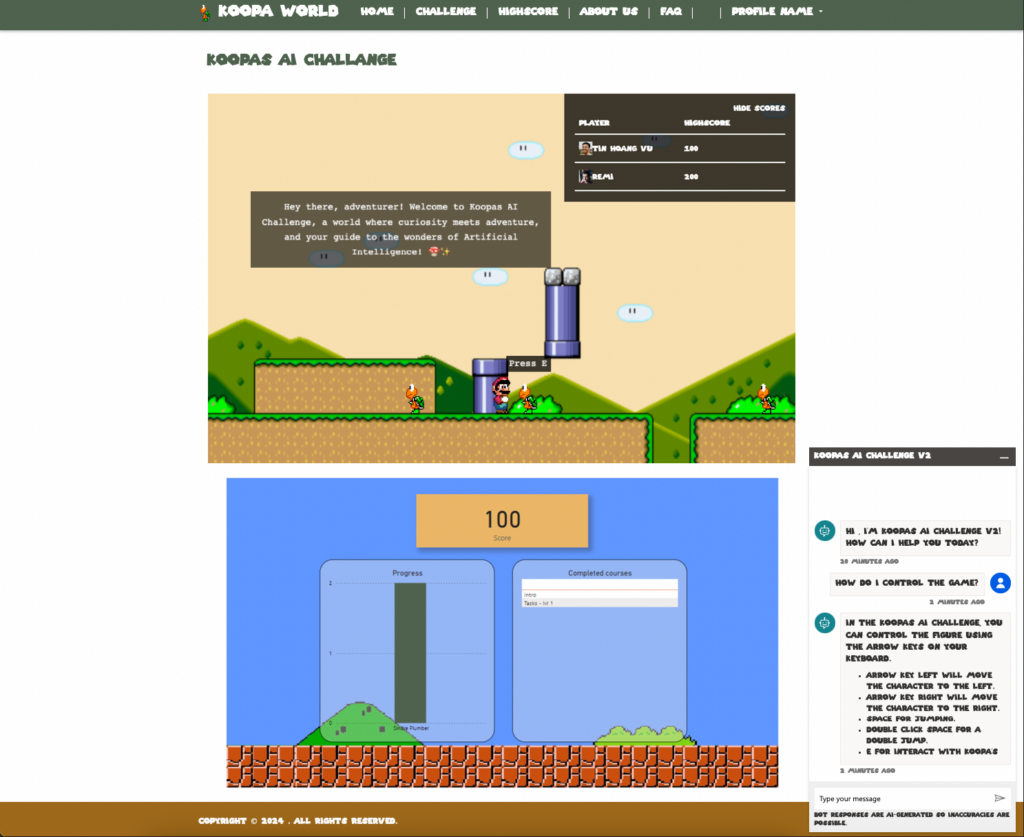
Our project’s crowning glory is the integration of an array of user features within a single screen, a feat that not only meets but exceeds the criteria for the Feature Bombing badge. This dense yet intuitive design includes the Power Page, PCF component, Highscore component, Power BI for current progress, and a Chatbot. Each element is crafted to complement the others, providing a comprehensive, engaging user experience without overwhelming the interface. This strategic feature cramming showcases our team’s ability to balance complexity with coherence, ensuring every addition delivers value and enhances usability.
As we conclude this intense development phase, our array of badges reflects more than just our technical achievements; they’re a testament to our team’s innovative spirit, collaborative ethos, and unwavering commitment to excellence. These badges aren’t just accolades; they’re milestones on our journey of learning, growth, and contribution in the dynamic world of hackathons.
All data and in our app communicaation is happening within our own tenant and using services within our tenant. The rules we have created for compliance and security will also apply to the game we have created.
Governance should and can de done using the tools you use to manage and audit security, privacy and compliance for Microsoft 365, Azure and Dynamics.
If the solution is used on other tenants, the rules for that tenant will be applied.
Azure OpenAI, keeps the information in the tenant, and will adhere to the privacy rules and ethics that has been apllied to it.
User are all authenticated and given permission to the solution and tables.
Data is stored in Dataverse. We govern the data in this solution and will be alerted if there are store any personal information. We do not store anything that the users puts into the prompt.
Just a few administrators have access to give other people permissions to use the app.
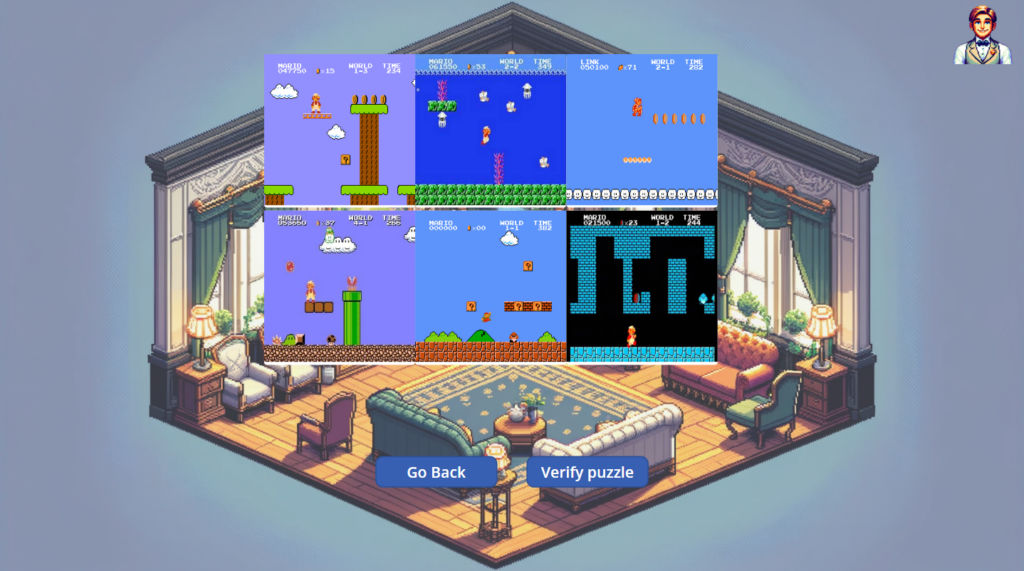
We can we to four games and a power bi report from the Power Pages site
Power User Love
The Power Pages site is showing that we can use pro code (the game) and low code together seamlessly
Client Side Salsa
All the games and the website is browser based and make up an extremely fluent and cohesive solution. It’s not a heavy monolith, but we have built each app individually.
Retro
We are using HTML and vanilla Javascript (ONLY) to make the interactive game on the website. No libraries, no dependencies, it’s sustainable to not load big libraries and only use a little bit of the code. This is very Retro! vanilla, baby!
Camelion
The website is fully responsive and work on mobile and desktop, enabling users on all devices to have fun with our game.
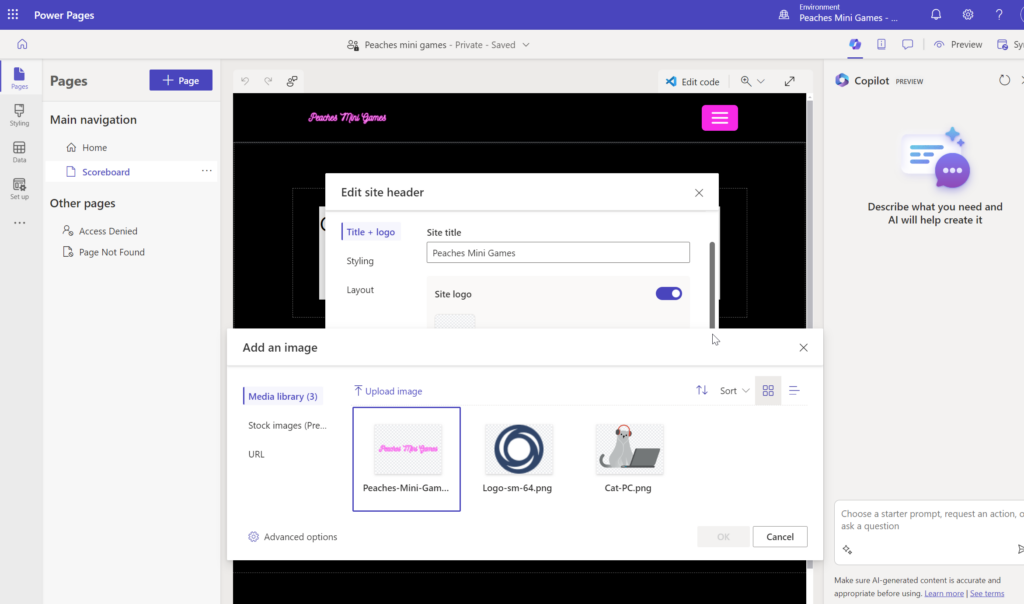
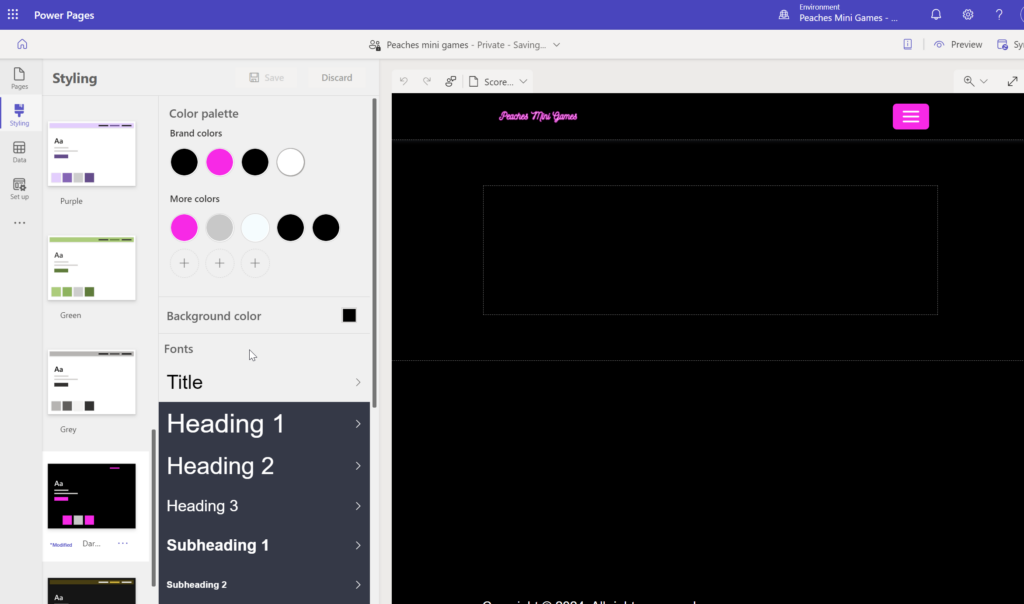
Styling Power Pages
Bringing it all together with a cohesive visual identity on the Power Pages site that will be the landing page for our game.
Setting the logo – no code style
Setting a theme – no code
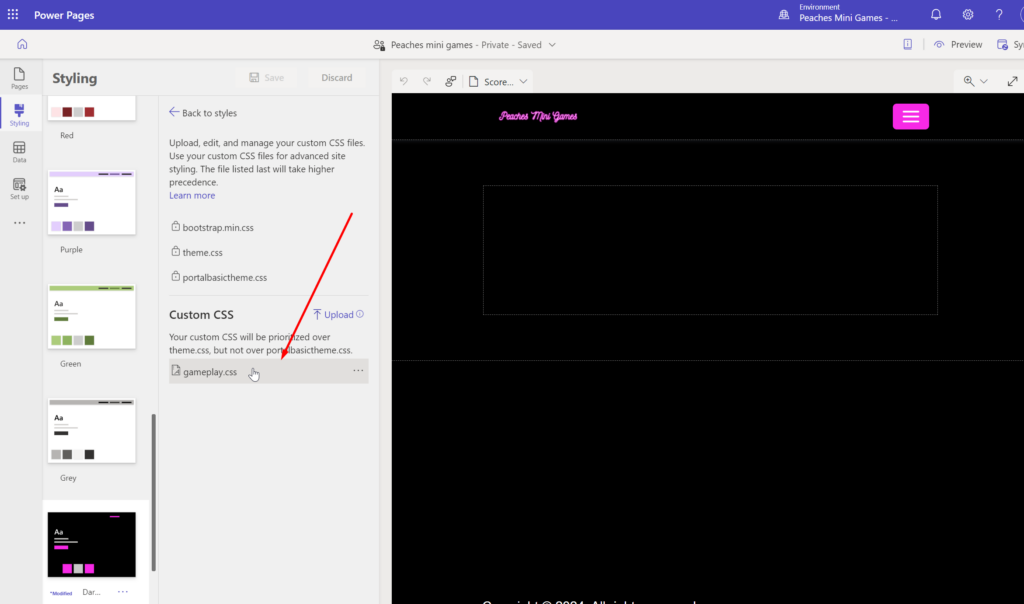
Adding Pro Code with custom CSS
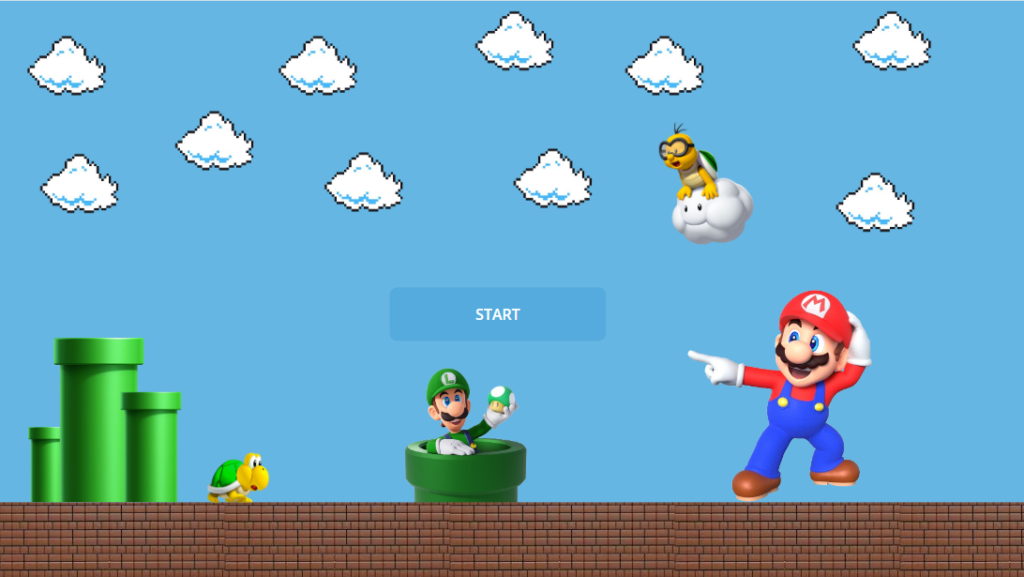
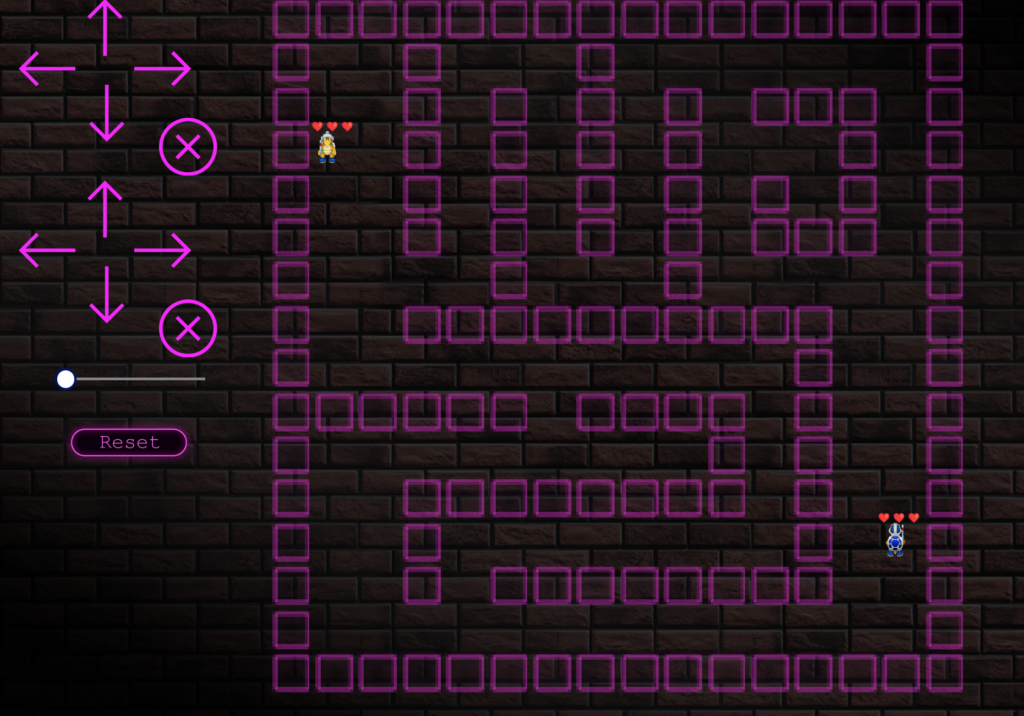
Game Play Pro Code in a Low Code solution
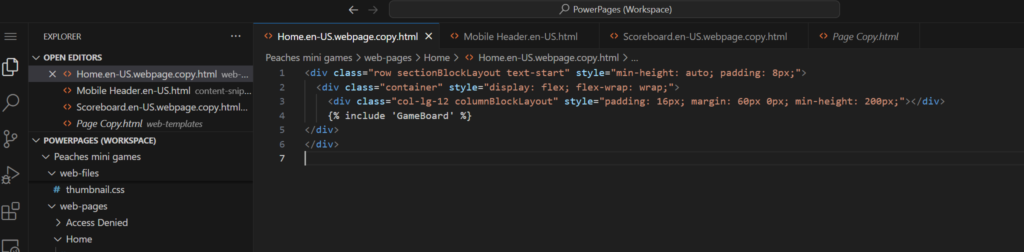
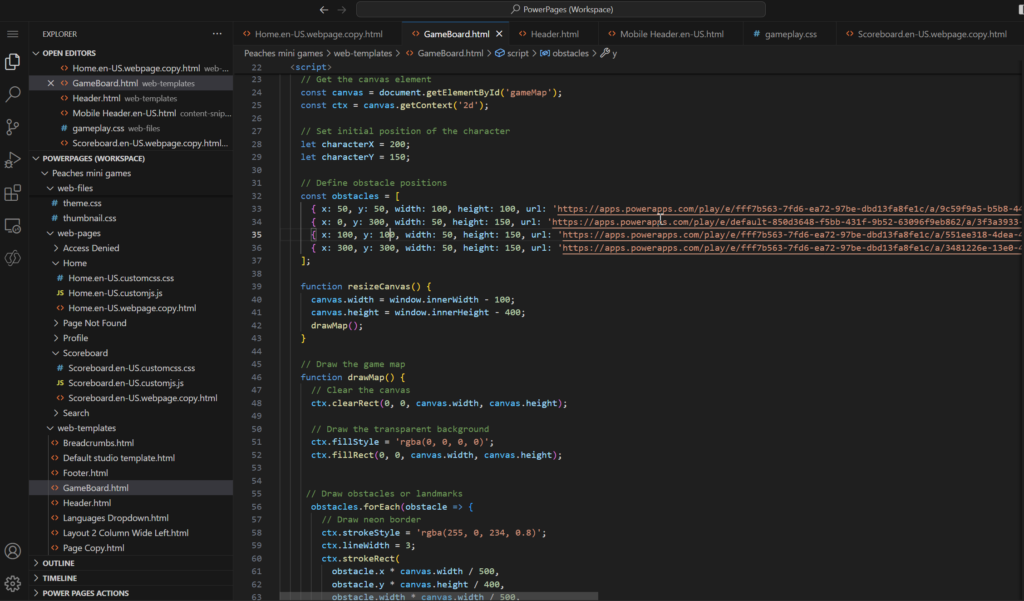
Adding the game code in a Web template and including it on the home page
The web template has HTML and vanilla Javascript.
You can find all the code of this web template in this open repository:
Of course the web page is responsive so that players can play from their desktop or phone. Some kids are not able to run outside and we want to be inclusive.
When Peaches hit one of the boxes, the game will be launched in a new tab for the user to play! How’s that for feature bombing!
Hangman
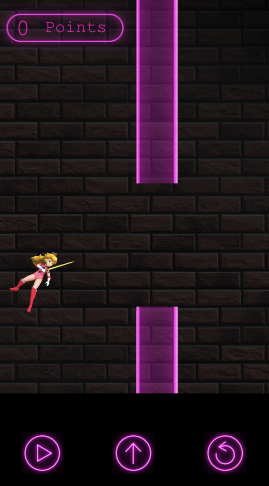
Peaches Flight
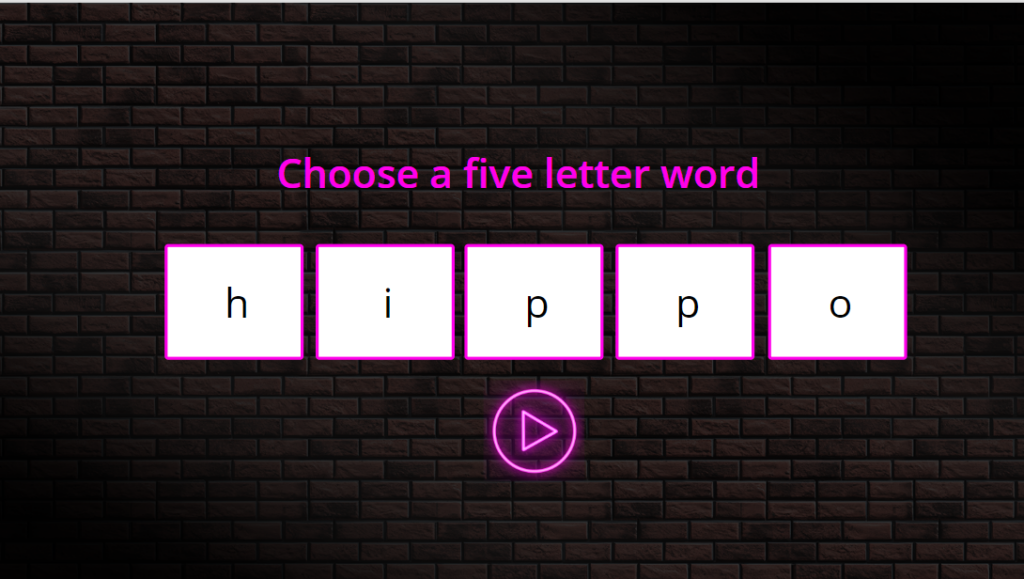
Glossary Test
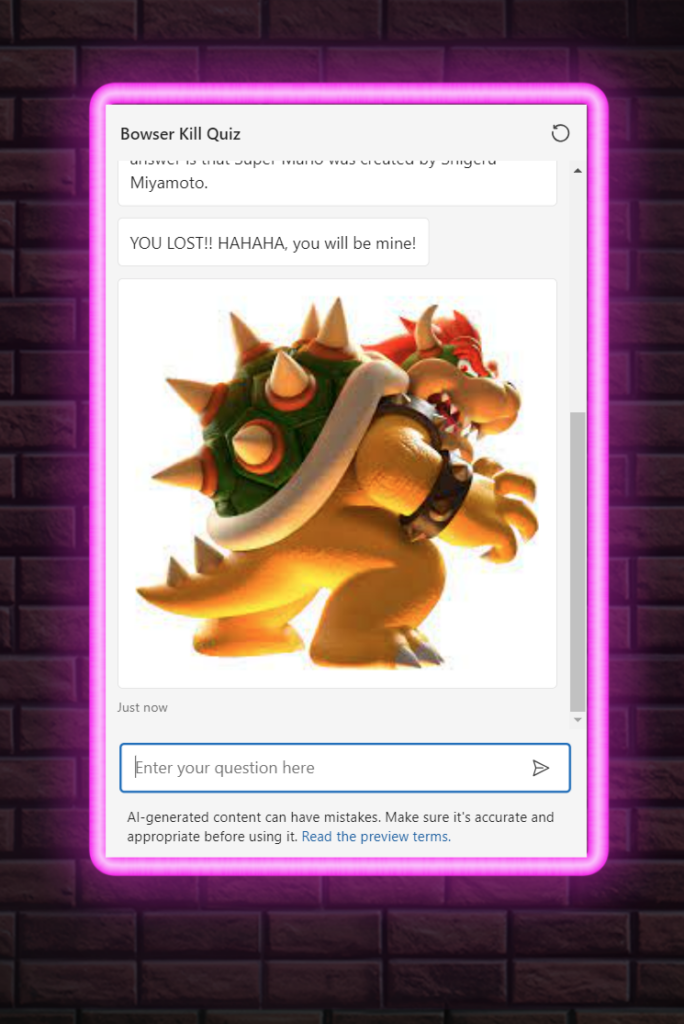
Bowser Kill Quiz
Hammer Bro Head 2Head
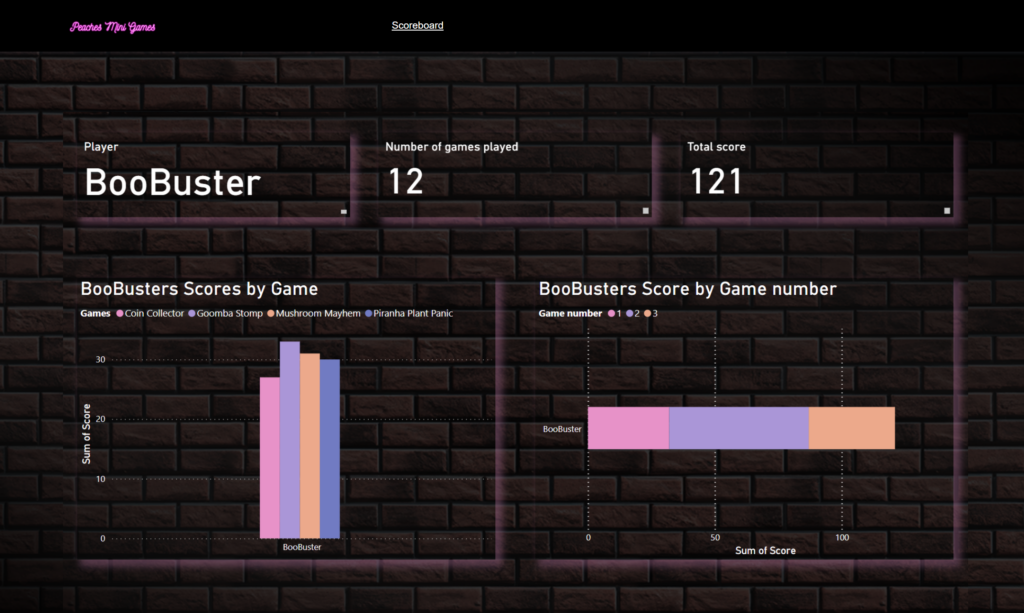
PowerBI report
We embedded the Power BI report in the Power Pages site to give the logged in user the ability to see where on the Scoreboard they are.
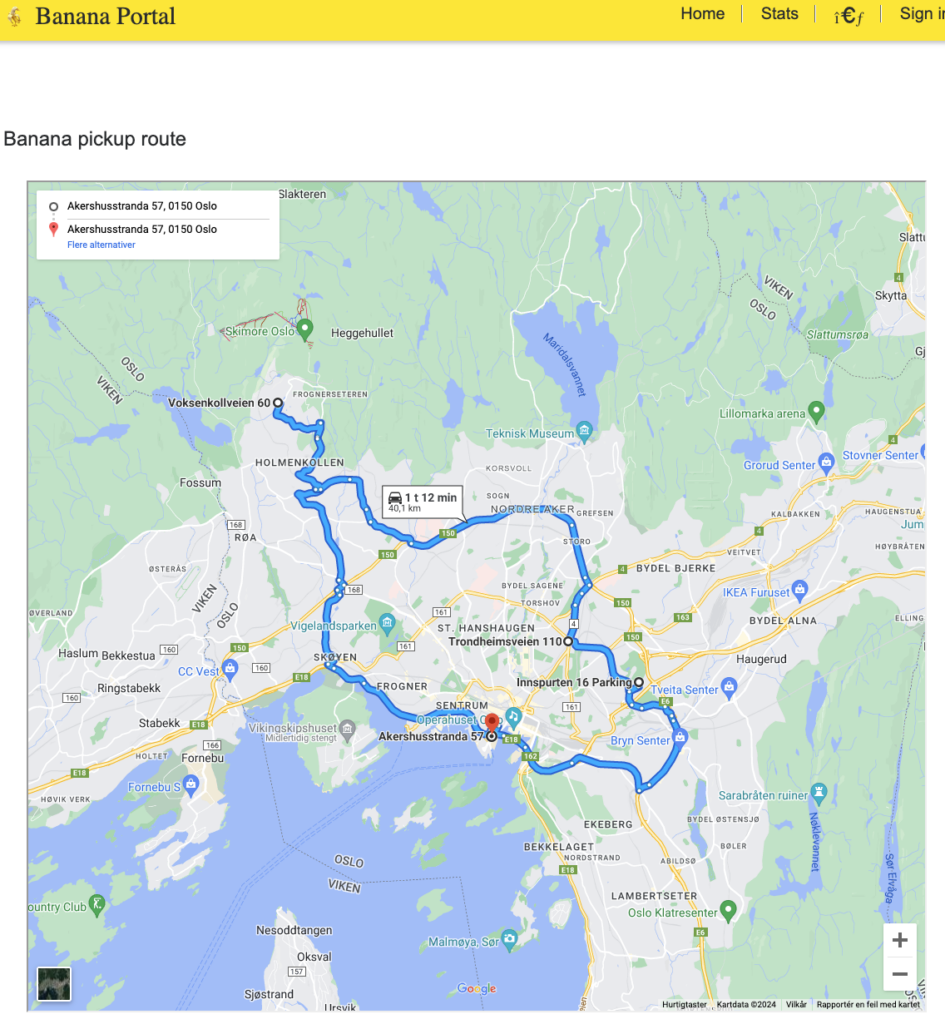
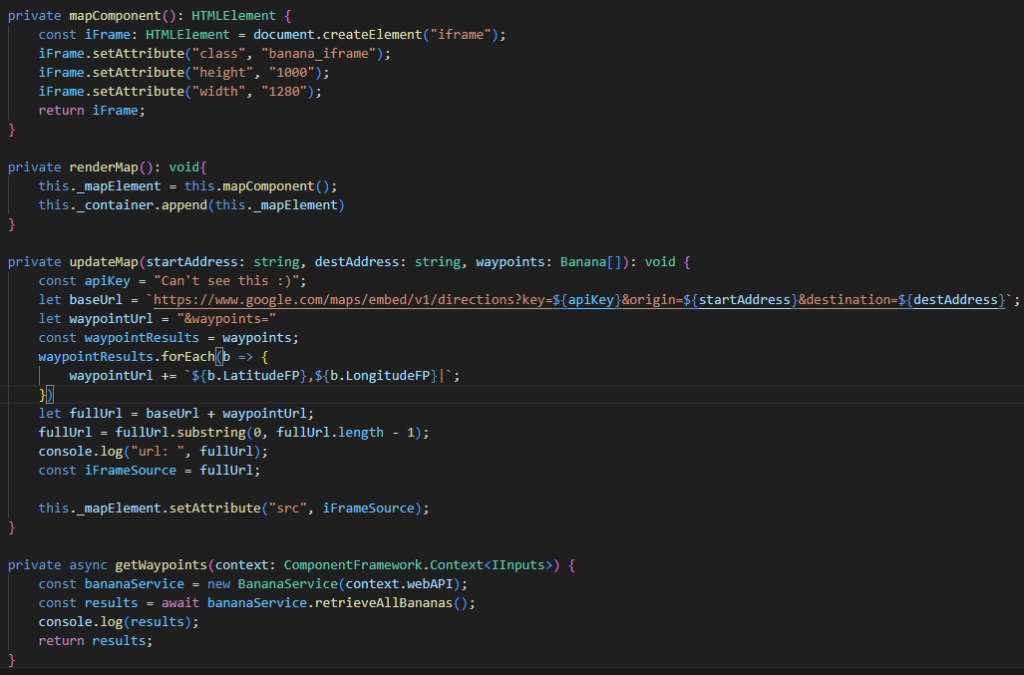
The Banana Portal™ includes a banana pickup route planner for the Norwegian Road Authority. Every detected banana is registered in Dataverse, added as a waypoint, and voila! An optimised route is calculated. Combining power pages (low code) and a PCF written in typescript: